MoneyGram 2005 Annual Report Download - page 96
Download and view the complete annual report
Please find page 96 of the 2005 MoneyGram annual report below. You can navigate through the pages in the report by either clicking on the pages listed below, or by using the keyword search tool below to find specific information within the annual report.-
 1
1 -
2
-
3
-
4
-
5
-
6
-
7
-
8
-
9
-
10
-
11
-
12
-
13
-
14
-
15
-
16
-
17
-
18
-
19
-
20
-
21
-
22
-
23
-
24
-
25
-
26
-
27
-
28
-
29
-
30
-
31
-
32
-
33
-
34
-
35
-
36
-
37
-
38
-
39
-
40
-
41
-
42
-
43
-
44
-
45
-
46
-
47
-
48
-
49
-
50
-
51
-
52
-
53
-
54
-
55
-
56
-
57
-
58
-
59
-
60
-
61
-
62
-
63
-
64
-
65
-
66
-
67
-
68
-
69
-
70
-
71
-
72
-
73
-
74
-
75
-
76
-
77
-
78
-
79
-
80
-
81
-
82
-
83
-
84
-
85
-
 86
86 -
 87
87 -
 88
88 -
 89
89 -
 90
90 -
 91
91 -
 92
92 -
 93
93 -
 94
94 -
 95
95 -
 96
96 -
 97
97 -
 98
98 -
 99
99 -
 100
100 -
 101
101 -
 102
102 -
 103
103 -
 104
104 -
 105
105 -
 106
106 -
107
-
108
-
109
-
110
-
111
-
112
-
113
-
114
-
115
-
116
-
117
-
118
-
119
-
120
-
121
-
122
-
123
-
124
-
125
-
126
-
127
-
128
-
129
-
130
-
131
-
132
-
133
-
134
-
135
-
136
-
137
-
138
-
139
-
140
-
141
-
142
-
143
-
144
-
145
-
146
-
147
-
148
-
149
-
150
-
151
-
152
-
153
-
154
-
155
 |
 |
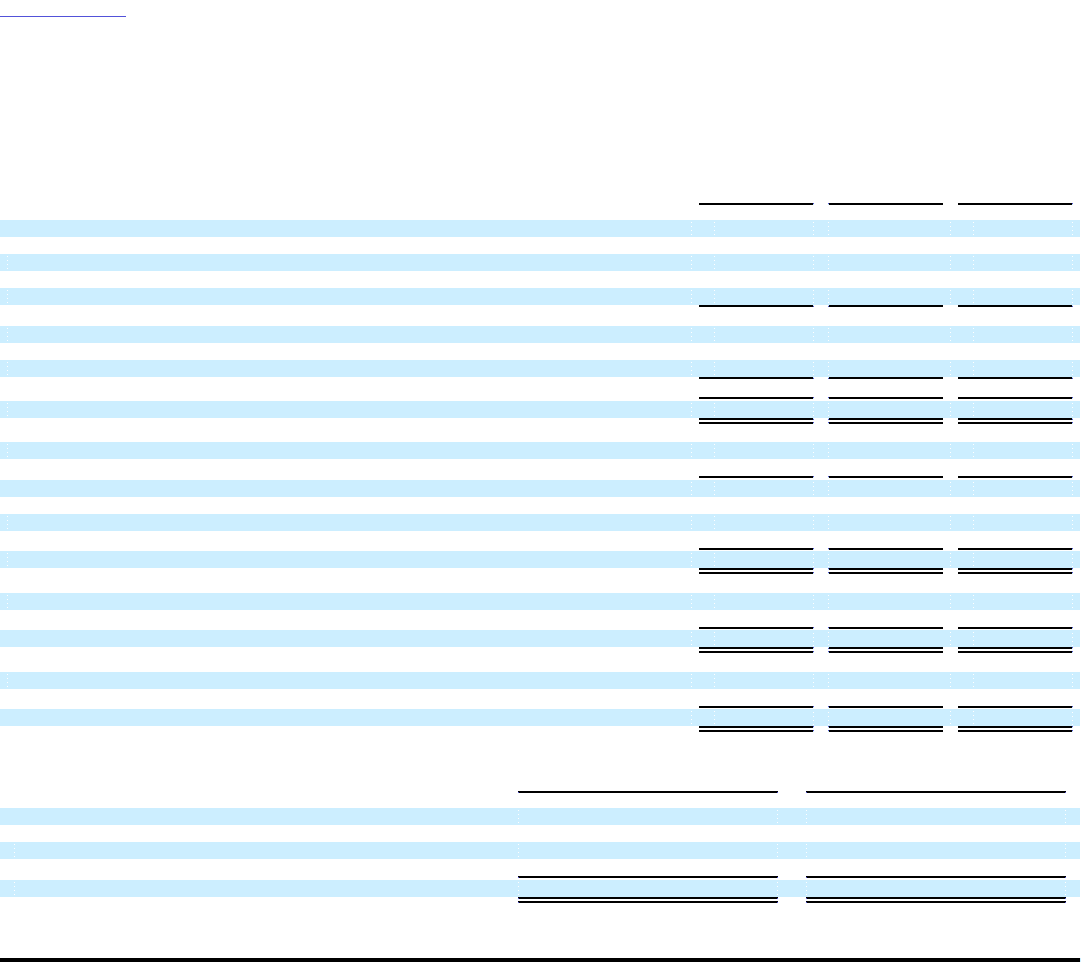
Table of Contents
MONEYGRAM INTERNATIONAL, INC. AND SUBSIDIARIES
NOTES TO CONSOLIDATED FINANCIAL STATEMENTS — (Continued)
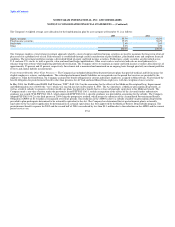
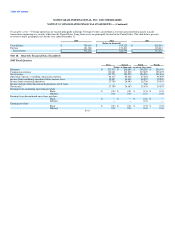
The following table reconciles segment operating income to the income from continuing operations before income taxes as reported in the financial statements
for the year ended December 31:
2005 2004 2003
(Dollars in thousands)
Revenue
Global Funds Transfer:
Money transfer, including bill payment $ 507,726 $ 395,370 $ 309,909
Retail money orders 139,430 133,012 134,288
Other 2,461 3,682 5,911
649,617 532,064 450,108
Payment Systems:
Official check and payment processing 297,289 269,971 264,881
Other 24,330 24,495 22,234
321,619 294,466 287,115
Total revenue $ 971,236 $ 826,530 $ 737,223
Operating Income
Global Funds Transfer $ 121,677 $ 102,606 $ 96,823
Payment Systems 42,406 27,163 15,123
164,083 129,769 111,946
Debt tender and redemption costs — 20,661 —
Interest expense 7,608 5,573 9,857
Other unallocated expenses 10,099 14,515 13,918
Income from continuing operations before income taxes $ 146,376 $ 89,020 $ 88,171
Depreciation and amortization
Global Funds Transfer $ 28,395 $ 25,856 $ 24,255
Payment Systems 4,070 3,711 3,040
$ 32,465 $ 29,567 $ 27,295
Capital expenditures
Global Funds Transfer $ 40,837 $ 27,712 $ 25,891
Payment Systems 6,522 1,877 1,237
$ 47,359 $ 29,589 $ 27,128
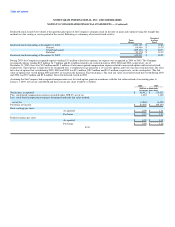
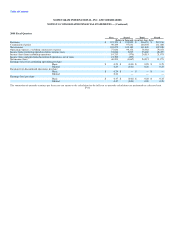
The following table reconciles segment assets to total assets reported in the financial statements as of December 31:
2005 2004
(Dollars in thousands)
Assets
Global funds transfer $ 2,835,246 $ 2,436,961
Payment systems 6,226,528 6,191,802
Corporate 13,390 1,972
Total assets $ 9,075,164 $ 8,630,735
F-42