MoneyGram 2005 Annual Report Download - page 60
Download and view the complete annual report
Please find page 60 of the 2005 MoneyGram annual report below. You can navigate through the pages in the report by either clicking on the pages listed below, or by using the keyword search tool below to find specific information within the annual report.-
 1
1 -
2
-
3
-
4
-
5
-
6
-
7
-
8
-
9
-
10
-
11
-
12
-
13
-
14
-
15
-
16
-
17
-
18
-
19
-
20
-
21
-
22
-
23
-
24
-
25
-
26
-
27
-
28
-
29
-
30
-
31
-
32
-
33
-
34
-
35
-
36
-
37
-
38
-
39
-
40
-
41
-
42
-
43
-
44
-
45
-
46
-
47
-
48
-
49
-
 50
50 -
 51
51 -
 52
52 -
 53
53 -
 54
54 -
 55
55 -
 56
56 -
 57
57 -
 58
58 -
 59
59 -
 60
60 -
 61
61 -
 62
62 -
 63
63 -
 64
64 -
 65
65 -
 66
66 -
 67
67 -
 68
68 -
 69
69 -
 70
70 -
71
-
72
-
73
-
74
-
75
-
76
-
77
-
78
-
79
-
80
-
81
-
82
-
83
-
84
-
85
-
86
-
87
-
88
-
89
-
90
-
91
-
92
-
93
-
94
-
95
-
96
-
97
-
98
-
99
-
100
-
101
-
102
-
103
-
104
-
105
-
106
-
107
-
108
-
109
-
110
-
111
-
112
-
113
-
114
-
115
-
116
-
117
-
118
-
119
-
120
-
121
-
122
-
123
-
124
-
125
-
126
-
127
-
128
-
129
-
130
-
131
-
132
-
133
-
134
-
135
-
136
-
137
-
138
-
139
-
140
-
141
-
142
-
143
-
144
-
145
-
146
-
147
-
148
-
149
-
150
-
151
-
152
-
153
-
154
-
155
 |
 |
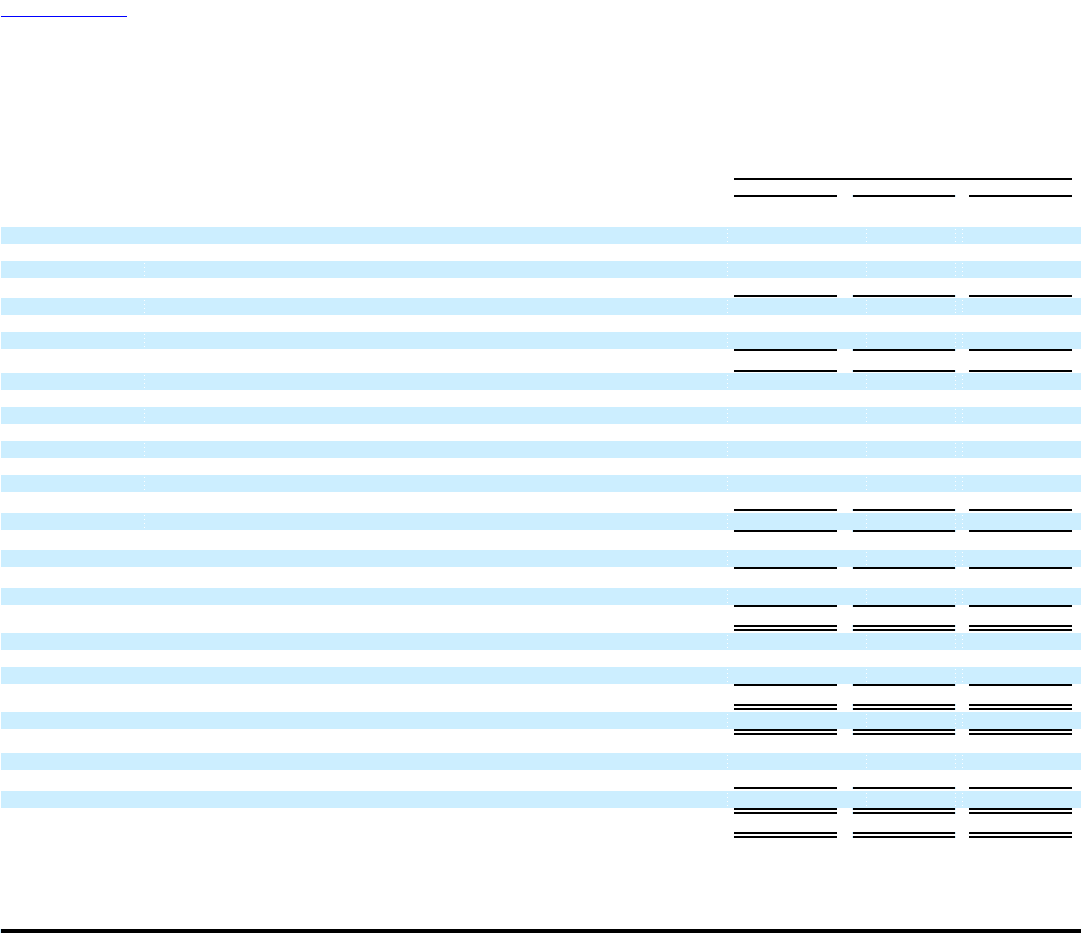
Table of Contents
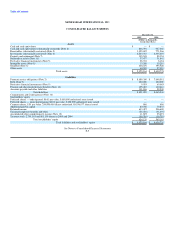
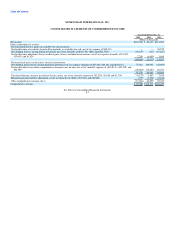
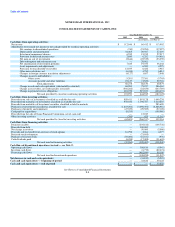
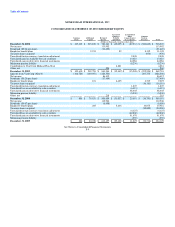
MONEYGRAM INTERNATIONAL, INC.
CONSOLIDATED STATEMENTS OF INCOME
Year Ended December 31,
2005 2004 2003
(Dollars in thousands, except
share and per share data)
Revenue:
Fee and other revenue (Note 2) $ 606,956 $ 500,940 $ 419,002
Investment revenue (Note 4) 367,989 315,983 323,099
Net securities (losses) gains (Note 4) (3,709) 9,607 (4,878)
Total revenue 971,236 826,530 737,223
Fee commissions expense (Note 2) 231,209 183,561 144,997
Investment commissions expense (Note 2) 239,263 219,912 232,336
Total commissions expense 470,472 403,473 377,333
Net revenue 500,764 423,057 359,890
Expenses:
Compensation and benefits 132,715 126,641 107,497
Transaction and operations support 150,038 120,767 101,513
Depreciation and amortization 32,465 29,567 27,295
Occupancy, equipment and supplies 31,562 30,828 25,557
Interest expense 7,608 5,573 9,857
Debt tender and redemption costs — 20,661 —
Total expenses 354,388 334,037 271,719
Income from continuing operations before income taxes 146,376 89,020 88,171
Income tax expense (Note 11) 34,170 23,891 12,485
Income from continuing operations 112,206 65,129 75,686
Income and gain from discontinued operations, net of tax (Note 3) 740 21,283 38,216
Net income $ 112,946 $ 86,412 $ 113,902
Basic earnings per share
Income from continuing operations $ 1.32 $ 0.75 $ 0.87
Income from discontinued operations, net of tax 0.01 0.24 0.44
Earnings per common share $ 1.33 $ 0.99 $ 1.31
Average outstanding common shares 84,675 86,916 86,223
Diluted earnings per share
Income from continuing operations $ 1.30 $ 0.75 $ 0.87
Income from discontinued operations, net of tax 0.01 0.24 0.44
Earnings per common share $ 1.31 $ 0.99 $ 1.31
Average outstanding and potentially dilutive common shares 85,970 87,330 86,619
See Notes to Consolidated Financial Statements
F-6