MoneyGram 2005 Annual Report Download - page 25
Download and view the complete annual report
Please find page 25 of the 2005 MoneyGram annual report below. You can navigate through the pages in the report by either clicking on the pages listed below, or by using the keyword search tool below to find specific information within the annual report.-
 1
1 -
2
-
3
-
4
-
5
-
6
-
7
-
8
-
9
-
10
-
11
-
12
-
13
-
14
-
 15
15 -
 16
16 -
 17
17 -
 18
18 -
 19
19 -
 20
20 -
 21
21 -
 22
22 -
 23
23 -
 24
24 -
 25
25 -
 26
26 -
 27
27 -
 28
28 -
 29
29 -
 30
30 -
 31
31 -
 32
32 -
 33
33 -
 34
34 -
 35
35 -
36
-
37
-
38
-
39
-
40
-
41
-
42
-
43
-
44
-
45
-
46
-
47
-
48
-
49
-
50
-
51
-
52
-
53
-
54
-
55
-
56
-
57
-
58
-
59
-
60
-
61
-
62
-
63
-
64
-
65
-
66
-
67
-
68
-
69
-
70
-
71
-
72
-
73
-
74
-
75
-
76
-
77
-
78
-
79
-
80
-
81
-
82
-
83
-
84
-
85
-
86
-
87
-
88
-
89
-
90
-
91
-
92
-
93
-
94
-
95
-
96
-
97
-
98
-
99
-
100
-
101
-
102
-
103
-
104
-
105
-
106
-
107
-
108
-
109
-
110
-
111
-
112
-
113
-
114
-
115
-
116
-
117
-
118
-
119
-
120
-
121
-
122
-
123
-
124
-
125
-
126
-
127
-
128
-
129
-
130
-
131
-
132
-
133
-
134
-
135
-
136
-
137
-
138
-
139
-
140
-
141
-
142
-
143
-
144
-
145
-
146
-
147
-
148
-
149
-
150
-
151
-
152
-
153
-
154
-
155
 |
 |

Table of Contents
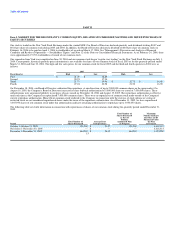
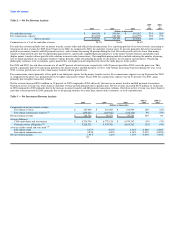
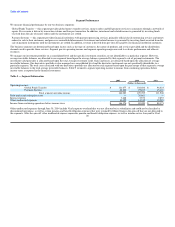
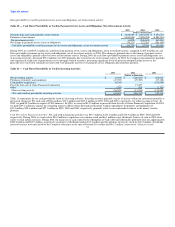
Table 2 — Net Fee Revenue Analysis
2005 2004
vs vs
2005 2004 2003 2004 2003
(Dollars in thousands)
Fee and other revenue $ 606,956 $ 500,940 $ 419,002 21% 20%
Fee commissions expense (231,209) (183,561) (144,997) 26% 27%
Net fee revenue $ 375,747 $ 317,379 $ 274,005 18% 16%
Commissions as a % of fee and other revenue 38.1% 36.6% 34.6%
Fee and other revenue includes fees on money transfer, money order and official check transactions. It is a growing portion of our total revenue, increasing to
62 percent of total revenue for 2005 from 52 percent in 2002. As compared to 2004, fee and other revenue grew 21 percent, primarily driven by transaction
growth in our money transfer and bill payment services, with volumes increasing 38 percent during the year. Revenue growth rates are lower than money
transfer volume growth rates due to targeted pricing initiatives, specifically simplified pricing initiatives, in the money transfer business and product mix
(higher money transfer volume growth with a decline in money order transactions). Our simplified pricing initiatives include reducing the number of pricing
tiers or bands and allows us to manage our price-volume dynamic while streamlining the point of sale process for our agents and customers. Our pricing
philosophy continues to be to maintain a price point below our higher priced competitor but above the niche players in the market.
For 2004 and 2003, fee and other revenue was 61 and 57 percent of total revenue, respectively, with 20 percent growth in 2004 versus the prior year. This
growth is primarily driven by transaction growth in our money transfer and bill payment services, with volume increasing 36 percent during the year. As in
2005, revenue growth rates are lower than money transfer volume growth rates.
Fee commissions consist primarily of fees paid to our third-party agents for the money transfer service. Fee commissions expense was up 26 percent for 2005
as compared to the prior year, primarily driven by higher transaction volume. Fiscal 2004 fee commissions expense was up 27 percent over 2003, again
primarily due to higher transaction volume.
Net fee revenue increased $58.4 million, or 18 percent, in 2005 compared to 2004, driven by the increase in money transfer and bill payment transactions.
Growth in net fee revenue was lower than fee and other revenue growth primarily due to product mix. Net fee revenue increased $43.4 million, or 16 percent,
in 2004 compared to 2003 primarily due to the increase in money transfer and bill payment transaction volumes. Growth in net fee revenue was lower than fee
and other revenue growth in 2004, primarily due to the pricing structure of certain large money order customers, as well as product mix.
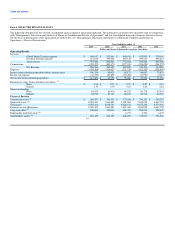
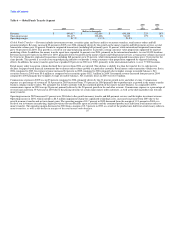
Table 3 — Net Investment Revenue Analysis
2005 vs 2004 vs
2005 2004 2003 2004 2003
(Dollars in thousands)
Components of net investment revenue:
Investment revenue $ 367,989 $ 315,983 $ 323,099 16% (2%)
Investment commissions expense (1) (239,263) (219,912) (232,336) 9% (5%)
Net investment revenue $ 128,726 $ 96,071 $ 90,763 34% 6%
Average balances:
Cash equivalents and investments $ 6,726,790 $ 6,772,124 $ 6,979,247 (1%) (3%)
Payment service obligations (2) 5,268,512 5,370,768 5,615,562 (2%) (4%)
Average yields earned and rates paid (3) :
Investment yield 5.47% 4.67% 4.63% 0.80% 0.04%
Investment commission rate 4.54% 4.09% 4.14% 0.45% (0.05%)
Net investment margin 1.91% 1.42% 1.30% 0.49% 0.12%
22