MoneyGram 2005 Annual Report Download - page 97
Download and view the complete annual report
Please find page 97 of the 2005 MoneyGram annual report below. You can navigate through the pages in the report by either clicking on the pages listed below, or by using the keyword search tool below to find specific information within the annual report.-
 1
1 -
2
-
3
-
4
-
5
-
6
-
7
-
8
-
9
-
10
-
11
-
12
-
13
-
14
-
15
-
16
-
17
-
18
-
19
-
20
-
21
-
22
-
23
-
24
-
25
-
26
-
27
-
28
-
29
-
30
-
31
-
32
-
33
-
34
-
35
-
36
-
37
-
38
-
39
-
40
-
41
-
42
-
43
-
44
-
45
-
46
-
47
-
48
-
49
-
50
-
51
-
52
-
53
-
54
-
55
-
56
-
57
-
58
-
59
-
60
-
61
-
62
-
63
-
64
-
65
-
66
-
67
-
68
-
69
-
70
-
71
-
72
-
73
-
74
-
75
-
76
-
77
-
78
-
79
-
80
-
81
-
82
-
83
-
84
-
85
-
86
-
 87
87 -
 88
88 -
 89
89 -
 90
90 -
 91
91 -
 92
92 -
 93
93 -
 94
94 -
 95
95 -
 96
96 -
 97
97 -
 98
98 -
 99
99 -
 100
100 -
 101
101 -
 102
102 -
 103
103 -
 104
104 -
 105
105 -
 106
106 -
 107
107 -
108
-
109
-
110
-
111
-
112
-
113
-
114
-
115
-
116
-
117
-
118
-
119
-
120
-
121
-
122
-
123
-
124
-
125
-
126
-
127
-
128
-
129
-
130
-
131
-
132
-
133
-
134
-
135
-
136
-
137
-
138
-
139
-
140
-
141
-
142
-
143
-
144
-
145
-
146
-
147
-
148
-
149
-
150
-
151
-
152
-
153
-
154
-
155
 |
 |

Table of Contents
MONEYGRAM INTERNATIONAL, INC. AND SUBSIDIARIES
NOTES TO CONSOLIDATED FINANCIAL STATEMENTS — (Continued)
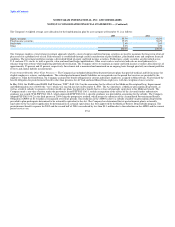
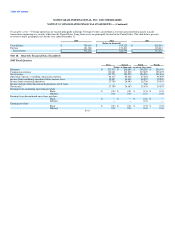
Geographic areas — Foreign operations are located principally in Europe. Foreign revenues are defined as revenues generated from money transfer
transactions originating in a country other than the United States. Long lived assets are principally located in the United States. The table below presents
revenue by major geographic area for the year ended December 31:
2005 2004 2003
(Dollars in thousands)
United States $ 789,410 $ 675,129 $ 618,610
Foreign 181,826 151,401 118,613
Total revenue $ 971,236 $ 826,530 $ 737,223
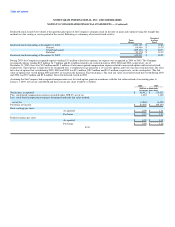
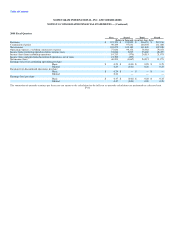
Note 18. Quarterly Financial Data (Unaudited)
2005 Fiscal Quarters
First Second Third Fourth
(Dollars in thousands, except per share data)
Revenues $ 227,915 $ 240,000 $ 246,385 $ 256,936
Commission expense 110,141 115,030 119,829 125,472
Net revenues 117,774 124,970 126,556 131,464
Operating expenses, excluding commission expense 82,117 88,665 87,682 95,925
Income from continuing operations before income taxes 35,657 36,305 38,874 35,539
Income from continuing operations 27,789 26,063 28,798 29,555
Income and gain from discontinued operations, net of taxes — — 740 —
Net income 27,789 26,063 29,538 29,555
Earnings from continuing operations per share
Basic $ 0.33 $ 0.31 $ 0.34 $ 0.35
Diluted 0.32 0.30 0.33 0.34
Earnings from discontinued operations per share
Basic $ — $ — $ 0.01 $ —
Diluted — — 0.01 —
Earnings per share
Basic $ 0.33 $ 0.31 $ 0.35 $ 0.35
Diluted 0.32 0.30 0.34 0.34
F-43