MoneyGram 2005 Annual Report Download - page 19
Download and view the complete annual report
Please find page 19 of the 2005 MoneyGram annual report below. You can navigate through the pages in the report by either clicking on the pages listed below, or by using the keyword search tool below to find specific information within the annual report.-
 1
1 -
2
-
3
-
4
-
5
-
6
-
7
-
8
-
 9
9 -
 10
10 -
 11
11 -
 12
12 -
 13
13 -
 14
14 -
 15
15 -
 16
16 -
 17
17 -
 18
18 -
 19
19 -
 20
20 -
 21
21 -
 22
22 -
 23
23 -
 24
24 -
 25
25 -
 26
26 -
 27
27 -
 28
28 -
 29
29 -
30
-
31
-
32
-
33
-
34
-
35
-
36
-
37
-
38
-
39
-
40
-
41
-
42
-
43
-
44
-
45
-
46
-
47
-
48
-
49
-
50
-
51
-
52
-
53
-
54
-
55
-
56
-
57
-
58
-
59
-
60
-
61
-
62
-
63
-
64
-
65
-
66
-
67
-
68
-
69
-
70
-
71
-
72
-
73
-
74
-
75
-
76
-
77
-
78
-
79
-
80
-
81
-
82
-
83
-
84
-
85
-
86
-
87
-
88
-
89
-
90
-
91
-
92
-
93
-
94
-
95
-
96
-
97
-
98
-
99
-
100
-
101
-
102
-
103
-
104
-
105
-
106
-
107
-
108
-
109
-
110
-
111
-
112
-
113
-
114
-
115
-
116
-
117
-
118
-
119
-
120
-
121
-
122
-
123
-
124
-
125
-
126
-
127
-
128
-
129
-
130
-
131
-
132
-
133
-
134
-
135
-
136
-
137
-
138
-
139
-
140
-
141
-
142
-
143
-
144
-
145
-
146
-
147
-
148
-
149
-
150
-
151
-
152
-
153
-
154
-
155
 |
 |

Table of Contents
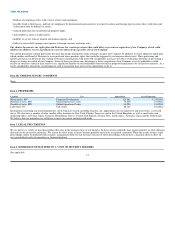
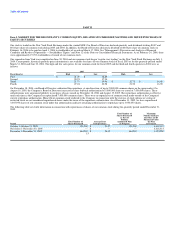
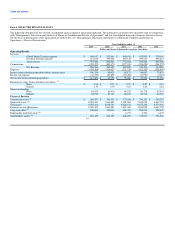
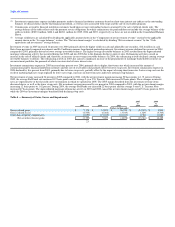
Item 6. SELECTED FINANCIAL DATA
The following table presents our selected consolidated financial data for the periods indicated. The information set forth below should be read in conjunction
with "Management's Discussion and Analysis of Financial Condition and Results of Operations" and our consolidated financial statements and notes thereto.
For the basis of presentation of the information set forth below, see "Management's Discussion and Analysis of Financial Condition and Results of
Operations — Basis of Presentation."
Years Ended December 31,
2005 2004 2003 2002 2001
(Dollars and shares in thousands, except per share data)
Operating Results
Revenue
Global Funds Transfer segment $ 649,617 $ 532,064 $ 450,108 $ 412,953 $ 379,945
Payment Systems segment 321,619 294,466 287,115 294,737 255,615
Total revenue 971,236 826,530 737,223 707,690 635,560
Commissions (470,472) (403,473) (377,333) (358,420) (301,272)
Net Revenue 500,764 423,057 359,890 349,270 334,288
Expenses (354,388) (334,037) (271,719) (262,583) (258,809)
Income from continuing operations before income taxes 146,376 89,020 88,171 86,687 75,479
Income tax expense (34,170) (23,891) (12,485) (11,923) (4,385)
Net income from continuing operations $ 112,206 $ 65,129 $ 75,686 $ 74,764 $ 71,094
Earnings per share from continuing operations: (1)
Basic $ 1.32 $ 0.75 $ 0.87 $ 0.87 $ 0.83
Diluted 1.30 0.75 0.87 0.86 0.82
Shares outstanding
Basic 84,675 86,916 86,223 86,178 85,503
Diluted 85,970 87,330 86,619 86,716 86,322
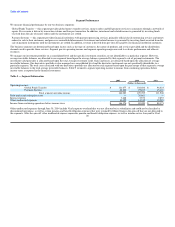
Financial Position
Unrestricted assets (2) $ 366,037 $ 393,920 $ 373,036 $ 346,122 $ 240,710
Restricted assets (2) 8,059,309 7,640,581 7,421,481 7,825,955 6,649,722
Total assets 9,075,164 8,630,735 9,222,154 9,675,430 8,375,301
Payment service obligations 8,059,309 7,640,581 7,421,481 7,825,955 6,649,722
Long-term debt (3) 150,000 150,000 201,351 294,879 322,670
Redeemable preferred stock (4) — — 6,733 6,704 6,679
Stockholders' equity (5) 624,129 565,191 868,783 718,947 758,556
16