MoneyGram 2005 Annual Report Download - page 74
Download and view the complete annual report
Please find page 74 of the 2005 MoneyGram annual report below. You can navigate through the pages in the report by either clicking on the pages listed below, or by using the keyword search tool below to find specific information within the annual report.-
 1
1 -
2
-
3
-
4
-
5
-
6
-
7
-
8
-
9
-
10
-
11
-
12
-
13
-
14
-
15
-
16
-
17
-
18
-
19
-
20
-
21
-
22
-
23
-
24
-
25
-
26
-
27
-
28
-
29
-
30
-
31
-
32
-
33
-
34
-
35
-
36
-
37
-
38
-
39
-
40
-
41
-
42
-
43
-
44
-
45
-
46
-
47
-
48
-
49
-
50
-
51
-
52
-
53
-
54
-
55
-
56
-
57
-
58
-
59
-
60
-
61
-
62
-
63
-
 64
64 -
 65
65 -
 66
66 -
 67
67 -
 68
68 -
 69
69 -
 70
70 -
 71
71 -
 72
72 -
 73
73 -
 74
74 -
 75
75 -
 76
76 -
 77
77 -
 78
78 -
 79
79 -
 80
80 -
 81
81 -
 82
82 -
 83
83 -
 84
84 -
85
-
86
-
87
-
88
-
89
-
90
-
91
-
92
-
93
-
94
-
95
-
96
-
97
-
98
-
99
-
100
-
101
-
102
-
103
-
104
-
105
-
106
-
107
-
108
-
109
-
110
-
111
-
112
-
113
-
114
-
115
-
116
-
117
-
118
-
119
-
120
-
121
-
122
-
123
-
124
-
125
-
126
-
127
-
128
-
129
-
130
-
131
-
132
-
133
-
134
-
135
-
136
-
137
-
138
-
139
-
140
-
141
-
142
-
143
-
144
-
145
-
146
-
147
-
148
-
149
-
150
-
151
-
152
-
153
-
154
-
155
 |
 |
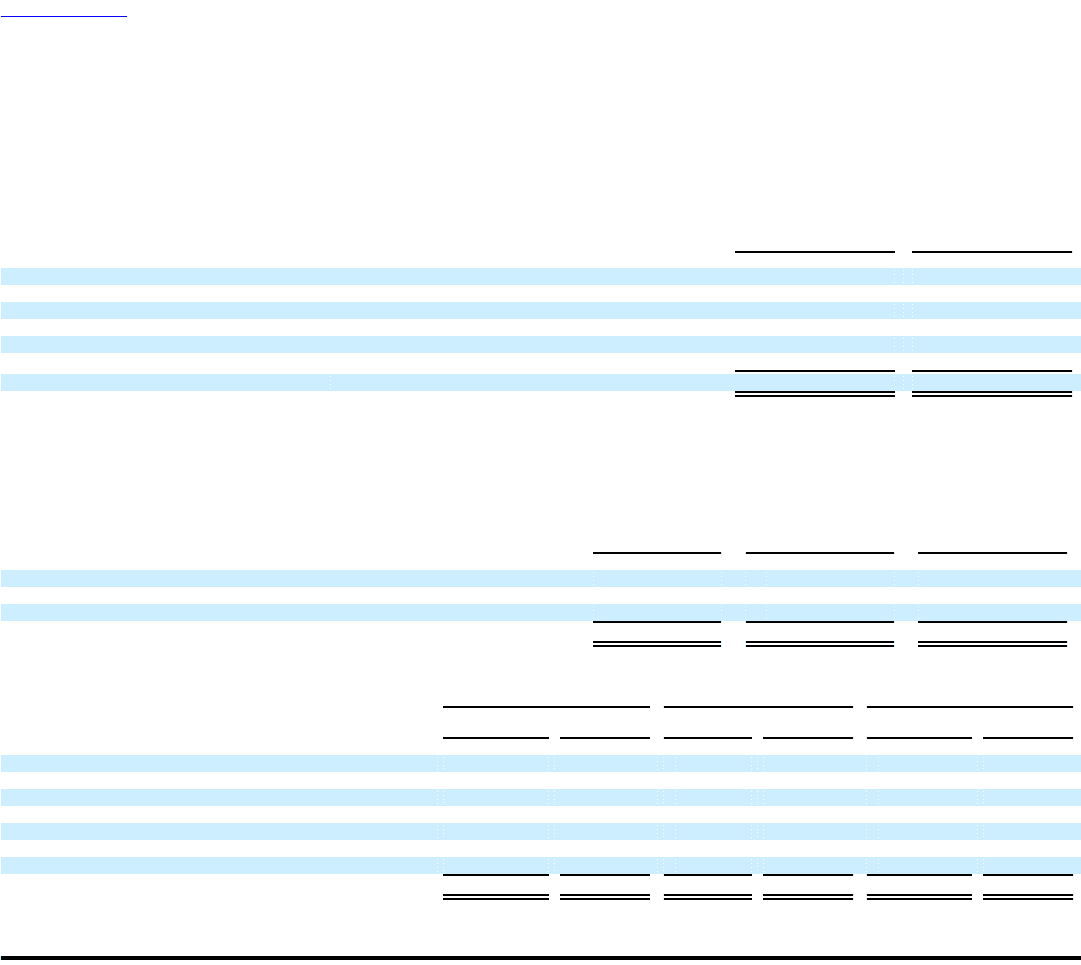
Table of Contents
MONEYGRAM INTERNATIONAL, INC. AND SUBSIDIARIES
NOTES TO CONSOLIDATED FINANCIAL STATEMENTS — (Continued)
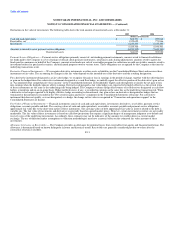
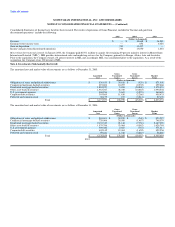
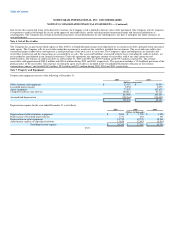
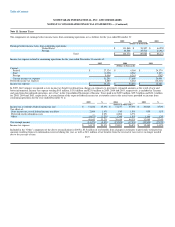
At December 31, 2005 and 2004, no securities were classified as held-to-maturity. The amortized cost and market value of securities at December 31, 2005,
by contractual maturity, are shown below. Actual maturities may differ from contractual maturities because borrowers may have the right to call or prepay
obligations, sometimes without call or prepayment penalties. Maturities of mortgage-backed and other asset-backed securities depend on the repayment
characteristics and experience of the underlying obligations.
Amortized Market
Cost Value
(Dollars in thousands)
In one year or less $ 58,267 $ 58,355
After one year through five years 654,490 671,408
After five years through ten years 547,063 565,164
After ten years 332,704 342,609
Mortgage-backed and other asset-backed securities 4,548,878 4,568,619
Preferred and common stock 30,175 27,178
Total $ 6,171,577 $ 6,233,333
At December 31, 2005 and 2004, net unrealized gains of $61.8 million ($38.3 million net of tax) and $158.6 million ($99.1 million net of tax), respectively,
are included in the Consolidated Balance Sheets in "Accumulated other comprehensive income (loss)." During 2005, 2004 and 2003, $1.8 million,
$16.0 million and $14.4 million, respectively, was reclassified from "Accumulated other comprehensive income (loss)" to earnings in connection with the sale
of the underlying securities.
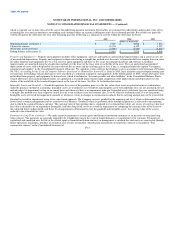
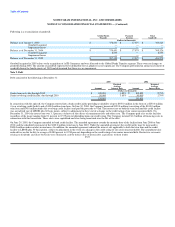
Gross realized gains and losses on sales of securities classified as available-for-sale, using the specific identification method, and other-than-temporary
impairments were as follows for the year ended December 31:
2005 2004 2003
(Dollars in thousands)
Gross realized gains $ 7,378 $ 31,903 $ 26,058
Gross realized losses (4,535) (6,364) (3,019)
Other-than-temporary impairments (6,552) (15,932) (27,917)
Net securities (losses) gains $ (3,709) $ 9,607 $ (4,878)
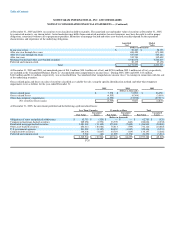
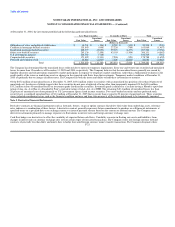
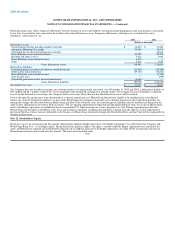
At December 31, 2005, the investment portfolio had the following aged unrealized losses:
Less Than 12 months 12 months or More Total
Unrealized Unrealized Unrealized
Fair Value Losses Fair Value Losses Fair Value Losses
(Dollars in thousands)
Obligations of states and political subdivisions $ 62,783 $ (529) $ — $ — $ 62,783 $ (529)
Commercial mortgage-backed securities 209,056 (1,572) 33,770 (663) 242,826 (2,235)
Residential mortgage-backed securities 1,081,400 (13,105) 375,400 (7,695) 1,456,800 (20,800)
Other asset-backed securities 656,313 (10,086) 75,813 (799) 732,126 (10,885)
U.S. government agencies 241,994 (3,327) 80,452 (1,947) 322,446 (5,274)
Corporate debt securities 104,438 (1,847) 30,719 (419) 135,157 (2,266)
Preferred and common stock 9,960 (40) 11,290 (3,174) 21,250 (3,214)
Total $ 2,365,944 $ (30,506) $ 607,444 $ (14,697) $ 2,973,388 $ (45,203)
F-20