MoneyGram 2005 Annual Report Download - page 29
Download and view the complete annual report
Please find page 29 of the 2005 MoneyGram annual report below. You can navigate through the pages in the report by either clicking on the pages listed below, or by using the keyword search tool below to find specific information within the annual report.-
 1
1 -
2
-
3
-
4
-
5
-
6
-
7
-
8
-
9
-
10
-
11
-
12
-
13
-
14
-
15
-
16
-
17
-
18
-
 19
19 -
 20
20 -
 21
21 -
 22
22 -
 23
23 -
 24
24 -
 25
25 -
 26
26 -
 27
27 -
 28
28 -
 29
29 -
 30
30 -
 31
31 -
 32
32 -
 33
33 -
 34
34 -
 35
35 -
 36
36 -
 37
37 -
 38
38 -
 39
39 -
40
-
41
-
42
-
43
-
44
-
45
-
46
-
47
-
48
-
49
-
50
-
51
-
52
-
53
-
54
-
55
-
56
-
57
-
58
-
59
-
60
-
61
-
62
-
63
-
64
-
65
-
66
-
67
-
68
-
69
-
70
-
71
-
72
-
73
-
74
-
75
-
76
-
77
-
78
-
79
-
80
-
81
-
82
-
83
-
84
-
85
-
86
-
87
-
88
-
89
-
90
-
91
-
92
-
93
-
94
-
95
-
96
-
97
-
98
-
99
-
100
-
101
-
102
-
103
-
104
-
105
-
106
-
107
-
108
-
109
-
110
-
111
-
112
-
113
-
114
-
115
-
116
-
117
-
118
-
119
-
120
-
121
-
122
-
123
-
124
-
125
-
126
-
127
-
128
-
129
-
130
-
131
-
132
-
133
-
134
-
135
-
136
-
137
-
138
-
139
-
140
-
141
-
142
-
143
-
144
-
145
-
146
-
147
-
148
-
149
-
150
-
151
-
152
-
153
-
154
-
155
 |
 |

Table of Contents
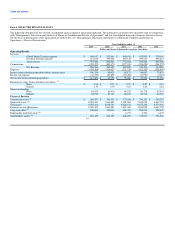
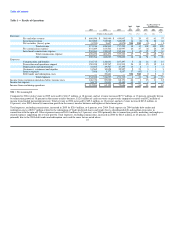
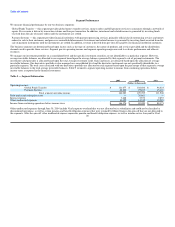
Segment Performance
We measure financial performance by our two business segments:
Global Funds Transfer — this segment provides global money transfer services, money orders and bill payment services to consumers through a network of
agents. Fee revenue is driven by transaction volume and fees per transaction. In addition, investment and related income is generated by investing funds
received from the sale of money orders until the instruments are settled.
Payment Systems — this segment provides financial institutions with payment processing services, primarily official check outsourcing services and money
orders for sale to their customers, and processes controlled disbursements. Investment and related income is generated by investing funds received from the
sale of payment instruments until the instruments are settled. In addition, revenue is derived from per-item fees paid by our financial institution customers.
The business segments are determined based upon factors such as the type of customers, the nature of products and services provided and the distribution
channels used to provide those services. Segment pre-tax operating income and segment operating margin are used to evaluate performance and allocate
resources.
We manage our investment portfolio on a consolidated level and the specific investment securities are not identifiable to a particular segment. However,
average investable balances are allocated to our segments based upon the average balances generated by that segment's sale of payment instruments. The
investment yield generally is allocated based upon the total average investment yield. Gains and losses are allocated based upon the allocation of average
investable balances. Our derivatives portfolio is also managed on a consolidated level and the derivative instruments are not specifically identifiable to a
particular segment. The total costs associated with our derivatives portfolio are allocated to each segment based upon the percentage of that segment's average
investable balances to the total average investable balances. Table 5 reconciles segment operating income to income from continuing operations before
income taxes as reported in the financial statements.
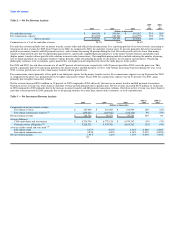
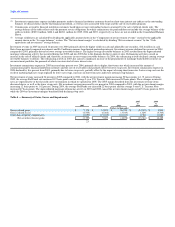
Table 5 — Segment Information
2005 2004 2003
(Dollars in thousands)
Operating income:
Global Funds Transfer $ 121,677 $ 102,606 $ 96,823
Payment Systems 42,406 27,163 15,123
Total segment operating income 164,083 129,769 111,946
Debt tender and redemption costs — 20,661 —
Interest expense 7,608 5,573 9,857
Other unallocated expenses 10,099 14,515 13,918
Income from continuing operations before income taxes $ 146,376 $ 89,020 $ 88,171
Other unallocated expenses through June 30, 2004 include Viad corporate overhead that was not allocated to its subsidiaries and could not be classified as
discontinued operations, as well as certain pension and benefit obligation expenses that were retained by MoneyGram in the spin-off that are not allocated to
the segments. After the spin-off, other unallocated expense represents pension and benefit obligation expense, as well as interim service fees paid to Viad.
26