MoneyGram 2005 Annual Report Download - page 30
Download and view the complete annual report
Please find page 30 of the 2005 MoneyGram annual report below. You can navigate through the pages in the report by either clicking on the pages listed below, or by using the keyword search tool below to find specific information within the annual report.-
 1
1 -
2
-
3
-
4
-
5
-
6
-
7
-
8
-
9
-
10
-
11
-
12
-
13
-
14
-
15
-
16
-
17
-
18
-
19
-
 20
20 -
 21
21 -
 22
22 -
 23
23 -
 24
24 -
 25
25 -
 26
26 -
 27
27 -
 28
28 -
 29
29 -
 30
30 -
 31
31 -
 32
32 -
 33
33 -
 34
34 -
 35
35 -
 36
36 -
 37
37 -
 38
38 -
 39
39 -
 40
40 -
41
-
42
-
43
-
44
-
45
-
46
-
47
-
48
-
49
-
50
-
51
-
52
-
53
-
54
-
55
-
56
-
57
-
58
-
59
-
60
-
61
-
62
-
63
-
64
-
65
-
66
-
67
-
68
-
69
-
70
-
71
-
72
-
73
-
74
-
75
-
76
-
77
-
78
-
79
-
80
-
81
-
82
-
83
-
84
-
85
-
86
-
87
-
88
-
89
-
90
-
91
-
92
-
93
-
94
-
95
-
96
-
97
-
98
-
99
-
100
-
101
-
102
-
103
-
104
-
105
-
106
-
107
-
108
-
109
-
110
-
111
-
112
-
113
-
114
-
115
-
116
-
117
-
118
-
119
-
120
-
121
-
122
-
123
-
124
-
125
-
126
-
127
-
128
-
129
-
130
-
131
-
132
-
133
-
134
-
135
-
136
-
137
-
138
-
139
-
140
-
141
-
142
-
143
-
144
-
145
-
146
-
147
-
148
-
149
-
150
-
151
-
152
-
153
-
154
-
155
 |
 |

Table of Contents
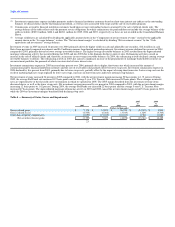
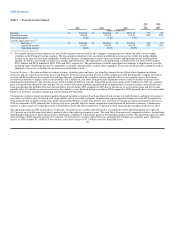
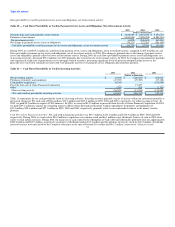
Table 6 — Global Funds Transfer Segment
2005 2004
vs vs
2005 2004 2003 2004 2003
(Dollars in thousands)
Revenue $ 649,617 $ 532,064 $ 450,108 22% 18%
Operating income 121,677 102,606 96,823 19% 6%
Operating margin 18.7% 19.3% 21.5%
Global Funds Transfer — Revenue includes investment revenue, securities gains and losses and fees on money transfers, retail money orders and bill
payment products. Revenue increased 22 percent in 2005 over 2004, primarily driven by the growth in the money transfer and bill payment services as total
transaction volume grew 38 percent. Domestic originated transactions (including bill payment) grew 39 percent, while international originated transactions
grew 36 percent from 2004. This growth is a result of our targeted pricing initiatives to provide a strong consumer value proposition supported by targeted
marketing efforts. In addition, the money transfer agent base expanded 16 percent over 2004, primarily in the international markets, to over 89,000 locations.
Revenue increased 18 percent in 2004 over 2003, primarily driven by growth in the money transfer and bill payment services as transaction volumes increased
by 36 percent. Domestic originated transactions (including bill payment) grew 38 percent, while international originated transactions grew 31 percent for the
same periods. This growth is a result of our targeted pricing initiatives to provide a strong consumer value proposition supported by targeted marketing
efforts. In addition, the money transfer agent base expanded 22 percent in 2004 over 2003, primarily in the international markets, to over 77,000 locations.
Retail money order transaction volume declined three percent from 2004 as expected. This decline is slightly less than the trend of five to eight percent
declines for paper-based financial instruments due to money order volume growth at a particular customer. Retail money order transaction volume was flat in
2004 compared to 2003. Investment revenue increased 24 percent in 2005 compared to 2004, primarily due to higher average investable balances. Net
securities losses in 2005 were $0.8 million as compared to net securities gains of $2.3 million in 2004. Investment revenue increased four percent in 2004
compared to 2003 primarily due to higher average investable balances. Net securities losses in 2003 were $1.0 million.
Commissions expense in 2005 was up 25 percent compared to 2004, primarily driven by the 23 percent growth in fee and other revenue. Commissions
expense as a percentage of revenue of 38.4 percent in 2005 increased from 37.6 percent in 2004 primarily due to product mix as growth in the money transfer
business outpaces money orders. We anticipate this trend to continue with the continued growth of the money transfer business. As compared to 2003,
commissions expense in 2004 was up 24 percent, primarily driven by the 20 percent growth in fee and other revenue. Commissions expense as a percentage of
revenue increased from 35.9 percent in 2003 due to the pricing structure of certain large money order customers, as well as the shift in product mix towards
money transfer.
Operating income in 2005 increased 19 percent over 2004 due to the growth in money transfer and bill payment services and the higher investment revenue.
Operating income in 2004, which includes a $4.5 million impairment charge for capitalized technology costs, increased six percent from 2003 due to the
growth in money transfer and net investment gains. The operating margin of 18.7 percent in 2005 decreased from the margin of 19.3 percent in 2004 as a
result of our investment in marketing, higher provisions for uncollectible agent receivables and the continued product mix shift from retail money orders to
money transfer. The operating margin decreased in 2004 from a margin of 21.5 percent in 2003 as a result of the product mix shift from retail money orders to
money transfers, as well as the decline in margins of the retail money order business.
27