MoneyGram 2005 Annual Report Download - page 34
Download and view the complete annual report
Please find page 34 of the 2005 MoneyGram annual report below. You can navigate through the pages in the report by either clicking on the pages listed below, or by using the keyword search tool below to find specific information within the annual report.-
 1
1 -
2
-
3
-
4
-
5
-
6
-
7
-
8
-
9
-
10
-
11
-
12
-
13
-
14
-
15
-
16
-
17
-
18
-
19
-
20
-
21
-
22
-
23
-
 24
24 -
 25
25 -
 26
26 -
 27
27 -
 28
28 -
 29
29 -
 30
30 -
 31
31 -
 32
32 -
 33
33 -
 34
34 -
 35
35 -
 36
36 -
 37
37 -
 38
38 -
 39
39 -
 40
40 -
 41
41 -
 42
42 -
 43
43 -
 44
44 -
45
-
46
-
47
-
48
-
49
-
50
-
51
-
52
-
53
-
54
-
55
-
56
-
57
-
58
-
59
-
60
-
61
-
62
-
63
-
64
-
65
-
66
-
67
-
68
-
69
-
70
-
71
-
72
-
73
-
74
-
75
-
76
-
77
-
78
-
79
-
80
-
81
-
82
-
83
-
84
-
85
-
86
-
87
-
88
-
89
-
90
-
91
-
92
-
93
-
94
-
95
-
96
-
97
-
98
-
99
-
100
-
101
-
102
-
103
-
104
-
105
-
106
-
107
-
108
-
109
-
110
-
111
-
112
-
113
-
114
-
115
-
116
-
117
-
118
-
119
-
120
-
121
-
122
-
123
-
124
-
125
-
126
-
127
-
128
-
129
-
130
-
131
-
132
-
133
-
134
-
135
-
136
-
137
-
138
-
139
-
140
-
141
-
142
-
143
-
144
-
145
-
146
-
147
-
148
-
149
-
150
-
151
-
152
-
153
-
154
-
155
 |
 |
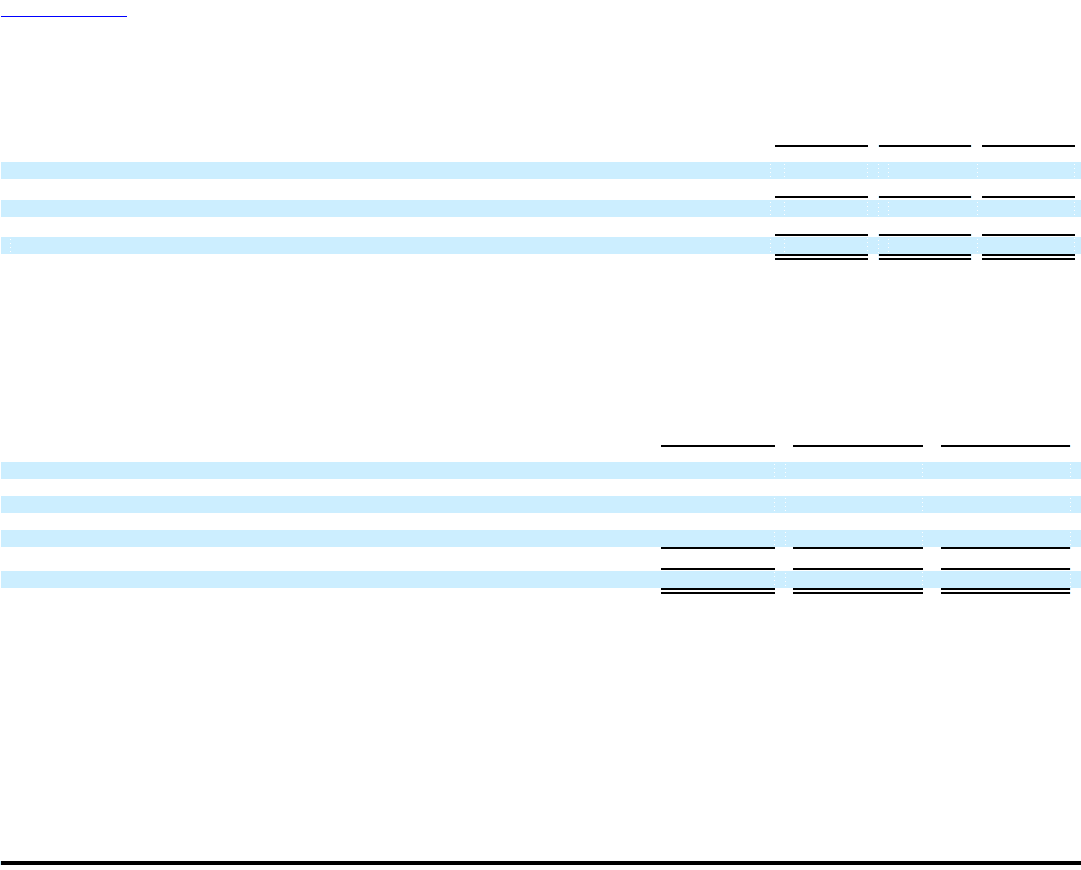
Table of Contents
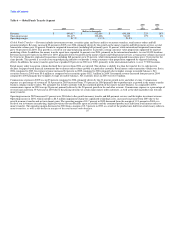
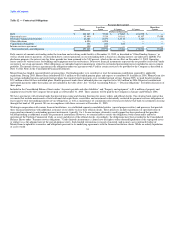
flows provided by or used by payment service assets and obligations, net of investment activity:
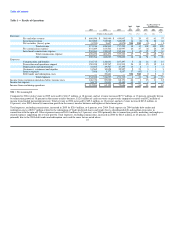
Table 10 — Cash Flows Provided By or Used In Payment Service Assets and Obligations, Net of Investment Activity
2005 2004 2003
(Dollars in thousands)
Proceeds from sales and maturities of investments $ 1,836,965 $ 2,851,895 $ 5,354,783
Purchases of investments (1,843,064) (3,098,498) (4,888,918)
Net investment activity (6,099) (246,603) 465,865
Net change in payment service assets or obligations (79,271) 272,383 (361,899)
Cash flows provided by (used in) payment service assets and obligations, net of investment activity $ (85,370) $ 25,780 $ 103,966
During 2005, we used $85.4 million in cash flows from payment service assets and obligations, net of investment activity, compared to $25.8 million in cash
flows provided by payment service assets and obligations, net of investment activity, in 2004. This change is primarily due to the timing of payment service
assets and obligations, partially offset by lower net investment activity. During 2004, the cash flows provided by payment service assets and obligations, net
of investment activity, decreased $78.2 million over 2003 primarily due to lower levels of investment activity. In 2003, the Company repositioned its portfolio
and experienced a high rate of prepayments on its mortgage-backed securities, generating significant levels of proceeds and purchasing activity as the
proceeds were reinvested. Amounts not reinvested were primarily used to cover payment service obligations presented for payment.
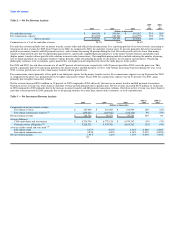
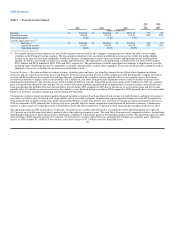
Table 11 — Cash Flows Provided By or Used In Investing Activities
2005 2004 2003
(Dollars in thousands)
Net investment activity $ (6,099) $ (246,603) $ 465,865
Purchases of property and equipment (47,359) (29,589) (27,128)
Cash paid for acquisitions (8,535) — (105,080)
Proceeds from sale of Game Financial Corporation — 15,247 —
Other (700) 428 (1,341)
Other investing activity (56,594) (13,914) (133,549)
Net cash (used in) provided by investing activities $ (62,693) $ (260,517) $ 332,316
Table 11 summarizes the net cash provided by (used in) investing activities. Investing activities primarily consist of activity within our investment portfolio as
previously discussed. We used cash of $56.6 million, $13.9 million and $133.5 million in 2005, 2004 and 2003, respectively, for other investing activity. In
2005, we paid $8.5 million to acquire ACH Commerce. In 2004, we received $15.2 million in proceeds from the sale of Game Financial Corporation. In 2003,
we paid $105.1 million to acquire the remaining interest in MoneyGram International Limited. Capital expenditures for property and equipment of
$47.4 million, $29.6 million and $27.1 million in 2005, 2004 and 2003, respectively, primarily relate to our continued investment in the money transfer
platform.
Cash Flows from Financing Activities: Net cash used in financing activities was $39.3 million, $110.4 million and $138.9 million in 2005, 2004 and 2003,
respectively. During 2005, we used cash of $50.0 million to repurchase our common stock and $6.1 million to pay dividends. Sources of cash in 2005 relate
solely to stock option exercises. During 2004, the main uses of cash related to the redemption of Viad's debt and redeemable preferred stock for approximately
$203.0 million and $23.9 million, respectively, payments of dividends totaling $17.4 million and the purchase of treasury stock for $16.2 million. (Dividends
paid and treasury stock purchased by the Company subsequent to the spin-off totaled $1.8 million and $16.2 million, respectively.) Sources of cash
31