MoneyGram 2005 Annual Report Download - page 38
Download and view the complete annual report
Please find page 38 of the 2005 MoneyGram annual report below. You can navigate through the pages in the report by either clicking on the pages listed below, or by using the keyword search tool below to find specific information within the annual report.-
 1
1 -
2
-
3
-
4
-
5
-
6
-
7
-
8
-
9
-
10
-
11
-
12
-
13
-
14
-
15
-
16
-
17
-
18
-
19
-
20
-
21
-
22
-
23
-
24
-
25
-
26
-
27
-
 28
28 -
 29
29 -
 30
30 -
 31
31 -
 32
32 -
 33
33 -
 34
34 -
 35
35 -
 36
36 -
 37
37 -
 38
38 -
 39
39 -
 40
40 -
 41
41 -
 42
42 -
 43
43 -
 44
44 -
 45
45 -
 46
46 -
 47
47 -
 48
48 -
49
-
50
-
51
-
52
-
53
-
54
-
55
-
56
-
57
-
58
-
59
-
60
-
61
-
62
-
63
-
64
-
65
-
66
-
67
-
68
-
69
-
70
-
71
-
72
-
73
-
74
-
75
-
76
-
77
-
78
-
79
-
80
-
81
-
82
-
83
-
84
-
85
-
86
-
87
-
88
-
89
-
90
-
91
-
92
-
93
-
94
-
95
-
96
-
97
-
98
-
99
-
100
-
101
-
102
-
103
-
104
-
105
-
106
-
107
-
108
-
109
-
110
-
111
-
112
-
113
-
114
-
115
-
116
-
117
-
118
-
119
-
120
-
121
-
122
-
123
-
124
-
125
-
126
-
127
-
128
-
129
-
130
-
131
-
132
-
133
-
134
-
135
-
136
-
137
-
138
-
139
-
140
-
141
-
142
-
143
-
144
-
145
-
146
-
147
-
148
-
149
-
150
-
151
-
152
-
153
-
154
-
155
 |
 |

Table of Contents
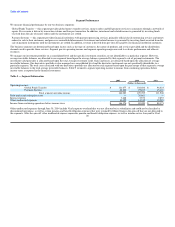
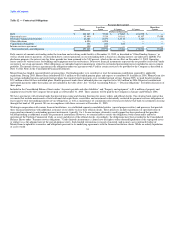
Off-Balance Sheet Arrangements
We have an agreement to sell, on a periodic basis, undivided percentage ownership interests in certain receivables, primarily from our money order agents, in
an amount not to exceed $450.0 million. These receivables are sold to commercial paper conduits (trusts) sponsored by a financial institution and represent a
small percentage of the total assets in these conduits. Our rights and obligations are limited to the receivables transferred, and are accounted for as sales
transactions under SFAS No. 140, Accounting for Transfers and Servicing of Financial Assets and Extinguishments of Liabilities. The assets and liabilities
associated with these conduits, including our sold receivables, are not recorded or included in our financial statements. The agreement expires in June 2006.
The business purpose of this arrangement is to accelerate cash flow for investment. The receivables are sold at a discount based upon short-term interest rates.
Executive management regularly reviews performance under the terms of the agreement. On average we sold receivables totaling $389.8 million during 2005
for a total discount of $13.5 million.
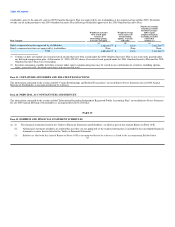
The Finance and Investment Committee of the Board of Directors generally must approve any transactions and strategies, including any potential off-balance
sheet arrangements, that materially affect investment results and cash flows.
ENTERPRISE RISK MANAGEMENT
Risk is an inherent part of our business, including interest rate risk, liquidity risk, credit risk, operational risk, regulatory risk and foreign currency exchange
risk. See Part 1, Item 1A "Risk Factors" for a description of the principal risks to our business.
The Company's risk management objective is to monitor and control risk exposures to produce steady earnings growth and long-term economic value. The
extent to which we properly and effectively manage each of the various types of risk is critical to our financial condition and profitability. Management
implements Board approved policies covering the Company's funding activity, investing activity and use of derivatives. The Company's Board of Directors
has established a Finance and Investment Committee, consisting of five independent Board members, which oversees the investment, capital, credit and
foreign currency policies and strategies. An Asset/ Liability Committee, comprised of senior management, routinely reviews investment and risk management
strategies and results. The Board's Finance and Investment Committee receives periodic reports regarding the investment portfolio and results.
Following is a discussion of the strategies used by the Company to manage and mitigate interest rate risk and credit risk. The following discussion contains
forward-looking statements. The analyses used to assess interest rate risk and credit risk are not predictions of future events, and actual results may vary
significantly due to events in the markets in which we operate and certain other factors as described in the following discussion.
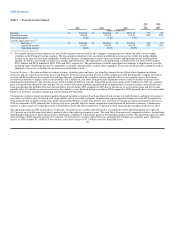
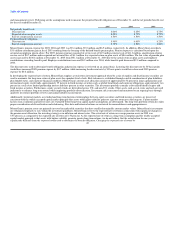
Interest Rate Risk
Interest rate risk represents the potential reduction in net investment revenue as a result of fluctuations in market interest rates. Fluctuations in interest rates
affect the revenue produced by our investment portfolio, the amount of commissions that we pay to customers in our Payment Systems segment, the net
proceeds from our sale of receivables and the amounts that we receive under our interest rate derivatives. As a result, our net investment revenue, which is the
difference or "spread" between the amount we earn on our investment portfolio and the commissions we pay and the discount on the sale of receivables, net of
the effect of interest rate derivatives or "swaps", is subject to interest rate risk as the components of net investment revenue are not perfectly matched through
time and across all possible interest rate scenarios. Interest rate risk is concentrated in the investment portfolio.
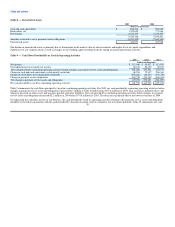
Certain investments in our portfolio, primarily fixed-rate mortgage-backed investments, are subject to prepayment with no penalty to the borrower. As interest
rates decrease, borrowers are more likely to prepay fixed-rate debt, resulting in cash flows that are received earlier than expected. Replacing the higher-rate
investments that prepay with lower rate investments could reduce our net investment revenue. Conversely, an increase in interest rates may result in slower
than expected prepayments and, therefore, cash flows that are received later than expected. In this case, there is risk that the cost of our commission payments
may reprice faster than our investments and at a higher cost, which could reduce our net investment revenue.
35