MoneyGram 2005 Annual Report Download - page 33
Download and view the complete annual report
Please find page 33 of the 2005 MoneyGram annual report below. You can navigate through the pages in the report by either clicking on the pages listed below, or by using the keyword search tool below to find specific information within the annual report.-
 1
1 -
2
-
3
-
4
-
5
-
6
-
7
-
8
-
9
-
10
-
11
-
12
-
13
-
14
-
15
-
16
-
17
-
18
-
19
-
20
-
21
-
22
-
 23
23 -
 24
24 -
 25
25 -
 26
26 -
 27
27 -
 28
28 -
 29
29 -
 30
30 -
 31
31 -
 32
32 -
 33
33 -
 34
34 -
 35
35 -
 36
36 -
 37
37 -
 38
38 -
 39
39 -
 40
40 -
 41
41 -
 42
42 -
 43
43 -
44
-
45
-
46
-
47
-
48
-
49
-
50
-
51
-
52
-
53
-
54
-
55
-
56
-
57
-
58
-
59
-
60
-
61
-
62
-
63
-
64
-
65
-
66
-
67
-
68
-
69
-
70
-
71
-
72
-
73
-
74
-
75
-
76
-
77
-
78
-
79
-
80
-
81
-
82
-
83
-
84
-
85
-
86
-
87
-
88
-
89
-
90
-
91
-
92
-
93
-
94
-
95
-
96
-
97
-
98
-
99
-
100
-
101
-
102
-
103
-
104
-
105
-
106
-
107
-
108
-
109
-
110
-
111
-
112
-
113
-
114
-
115
-
116
-
117
-
118
-
119
-
120
-
121
-
122
-
123
-
124
-
125
-
126
-
127
-
128
-
129
-
130
-
131
-
132
-
133
-
134
-
135
-
136
-
137
-
138
-
139
-
140
-
141
-
142
-
143
-
144
-
145
-
146
-
147
-
148
-
149
-
150
-
151
-
152
-
153
-
154
-
155
 |
 |
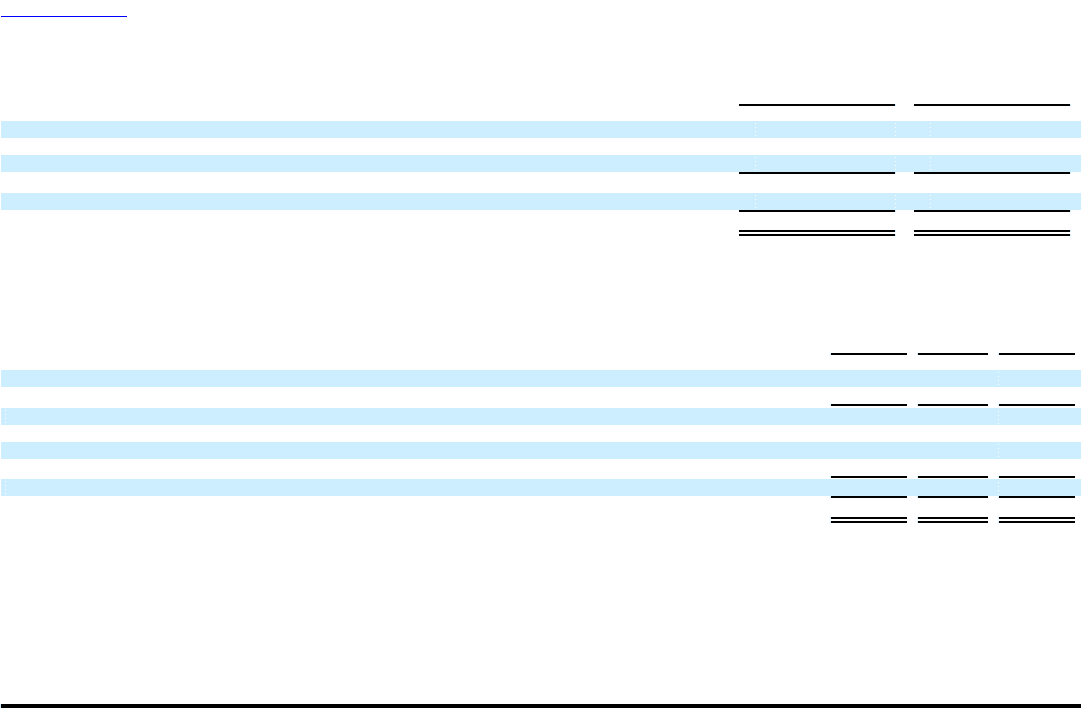
Table of Contents
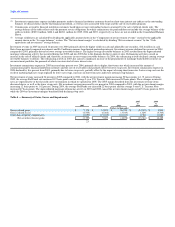
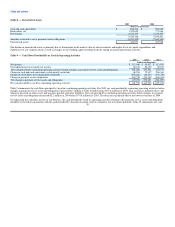
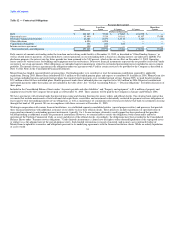
Table 8 — Unrestricted Assets
2005 2004
(Dollars in thousands)
Cash and cash equivalents $ 866,391 $ 927,042
Receivables, net 1,325,622 771,966
Investments 6,233,333 6,335,493
8,425,346 8,034,501
Amounts restricted to cover payment service obligations (8,059,309) (7,640,581)
Unrestricted assets $ 366,037 $ 393,920
The decline in unrestricted assets is primarily due to fluctuations in the market value of our investments and higher levels of capital expenditures and
repurchases of our common stock, as well as changes in our working capital resulting from the timing of normal operational activities.
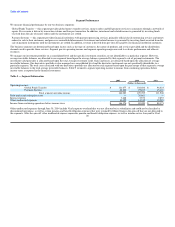
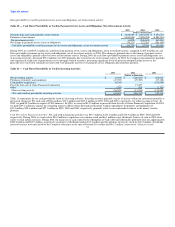
Table 9 — Cash Flows Provided By or Used In Operating Activities
2005 2004 2003
(Dollars in thousands)
Net income $ 112,946 $ 86,412 $ 113,902
Total adjustments to reconcile net income 68,278 86,150 60,875
Net cash provided by continuing operating activities before changes in payment service assets and obligations 181,224 172,562 174,777
Change in cash and cash equivalents (substantially restricted) 68,283 75,937 286,364
Change in receivables, net (substantially restricted) (566,282) (22,654) (243,789)
Change in payment service obligations 418,728 219,100 (404,474)
Net change in payment service assets and obligations (79,271) 272,383 (361,899)
Net cash provided by (used in) continuing operating activities $ 101,953 $ 444,945 $ (187,122)
Table 9 summarizes the cash flows provided by (used in) continuing operating activities. For 2005, net cash provided by continuing operating activities before
changes in payment service assets and obligations increased $8.7 million to $181.2 million from $172.6 million for 2004. This increase is primarily due to the
timing of payment on other assets and accounts payable and other liabilities. Net cash provided by continuing operating activities before changes in payment
service assets and obligations decreased $2.2 million in 2004 from $174.8 million for 2003. The decrease is primarily due to the lower net income in 2004.
To understand the cash flow activity of our business, the cash provided by (used in) operating activities relating to the payment service assets and obligations
should be reviewed in conjunction with the cash provided by (used in) investing activities related to our investment portfolio. Table 10 summarizes the cash
30