MoneyGram 2005 Annual Report Download - page 62
Download and view the complete annual report
Please find page 62 of the 2005 MoneyGram annual report below. You can navigate through the pages in the report by either clicking on the pages listed below, or by using the keyword search tool below to find specific information within the annual report.-
 1
1 -
2
-
3
-
4
-
5
-
6
-
7
-
8
-
9
-
10
-
11
-
12
-
13
-
14
-
15
-
16
-
17
-
18
-
19
-
20
-
21
-
22
-
23
-
24
-
25
-
26
-
27
-
28
-
29
-
30
-
31
-
32
-
33
-
34
-
35
-
36
-
37
-
38
-
39
-
40
-
41
-
42
-
43
-
44
-
45
-
46
-
47
-
48
-
49
-
50
-
51
-
 52
52 -
 53
53 -
 54
54 -
 55
55 -
 56
56 -
 57
57 -
 58
58 -
 59
59 -
 60
60 -
 61
61 -
 62
62 -
 63
63 -
 64
64 -
 65
65 -
 66
66 -
 67
67 -
 68
68 -
 69
69 -
 70
70 -
 71
71 -
 72
72 -
73
-
74
-
75
-
76
-
77
-
78
-
79
-
80
-
81
-
82
-
83
-
84
-
85
-
86
-
87
-
88
-
89
-
90
-
91
-
92
-
93
-
94
-
95
-
96
-
97
-
98
-
99
-
100
-
101
-
102
-
103
-
104
-
105
-
106
-
107
-
108
-
109
-
110
-
111
-
112
-
113
-
114
-
115
-
116
-
117
-
118
-
119
-
120
-
121
-
122
-
123
-
124
-
125
-
126
-
127
-
128
-
129
-
130
-
131
-
132
-
133
-
134
-
135
-
136
-
137
-
138
-
139
-
140
-
141
-
142
-
143
-
144
-
145
-
146
-
147
-
148
-
149
-
150
-
151
-
152
-
153
-
154
-
155
 |
 |
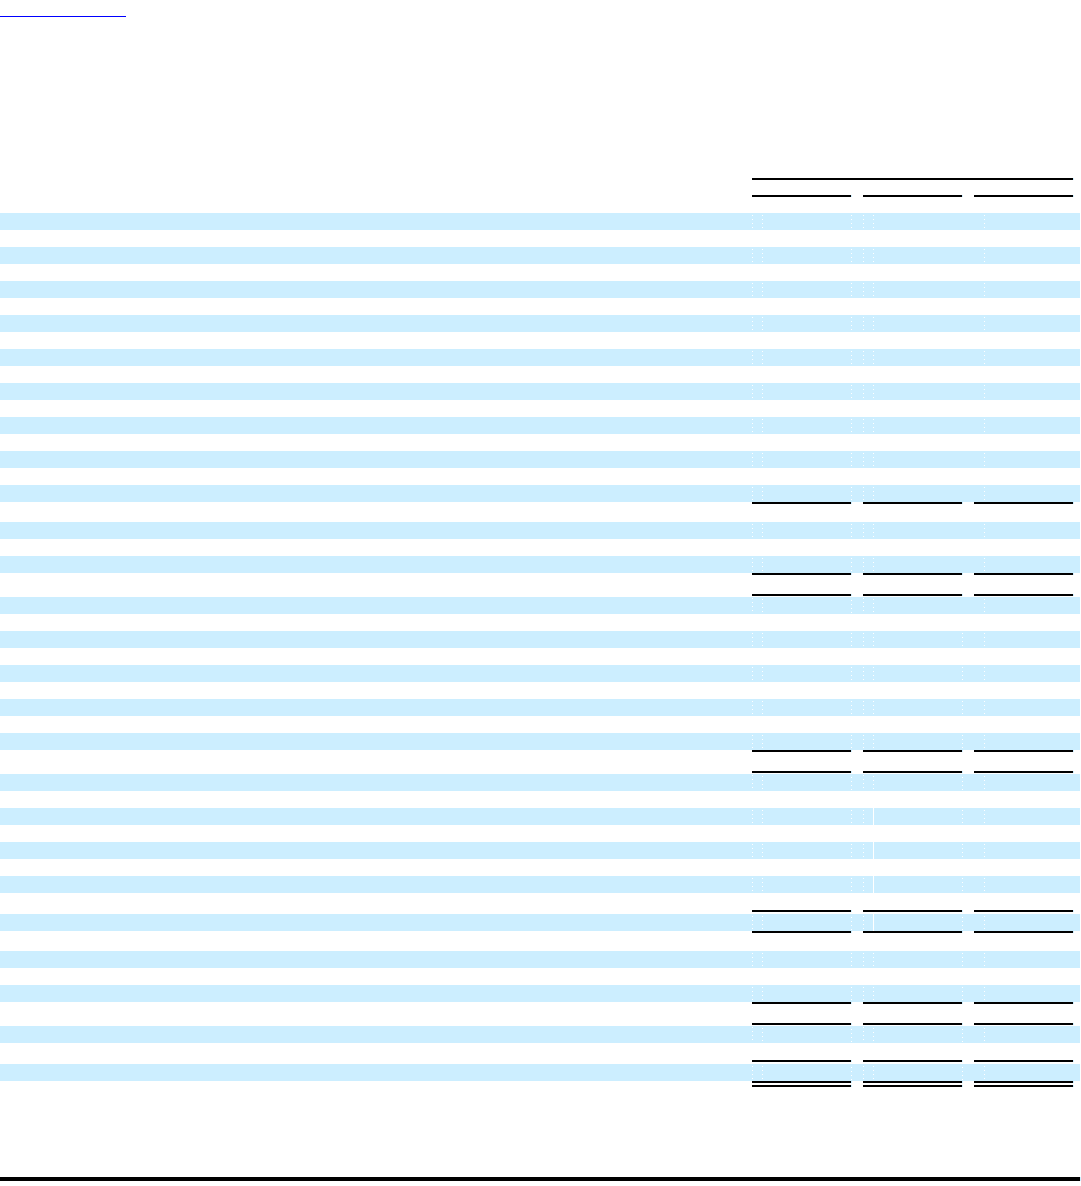
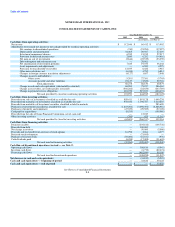
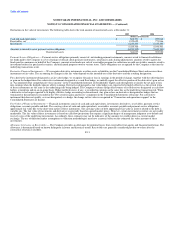
Table of Contents
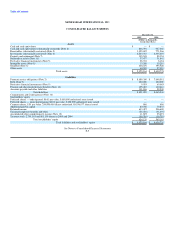
MONEYGRAM INTERNATIONAL, INC.
CONSOLIDATED STATEMENTS OF CASH FLOWS
Year Ended December 31,
2005 2004 2003
(As revised — see Note 2)
Cash flows from operating activities:
Net income $ 112,946 $ 86,412 $ 113,902
Adjustments to reconcile net income to net cash provided by (used in) operating activities:
Net earnings in discontinued operations (740) (21,283) (37,027)
Depreciation and amortization 32,465 29,567 27,295
Investment impairment charges 6,552 15,932 27,917
Provision for deferred income taxes 2,880 6,282 (14,416)
Net gain on sale of investments (2,844) (25,539) (23,039)
Debt redemption and retirement costs — 20,661 —
Net amortization of investment premium 7,645 19,070 38,242
Asset impairments and adjustments — 6,590 4,275
Provision for uncollectible receivables 12,935 6,422 3,987
Other non-cash items, net (6,414) 4,782 6,814
Changes in foreign currency translation adjustments (4,127) 1,807 2,848
Changes in assets and liabilities:
Other assets (3,201) 27,381 (5,745)
Accounts payable and other liabilities 23,127 (5,522) 29,724
Total adjustments 68,278 86,150 60,875
Change in cash and cash equivalents (substantially restricted) 68,283 75,937 286,364
Change in receivables, net (substantially restricted) (566,282) (22,654) (243,789)
Change in payment service obligations 418,728 219,100 (404,474)
Net cash provided by (used in) continuing operating activities 101,953 444,945 (187,122)
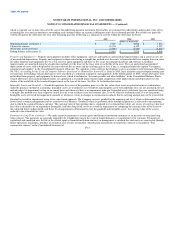
Cash flows from investing activities:
Proceeds from sales of investments classified as available-for-sale 858,411 1,053,128 1,660,238
Proceeds from maturities of investments classified as available-for-sale 978,554 1,798,767 3,410,855
Proceeds from maturities of investment securities classified as held-to-maturity — — 283,690
Purchases of investments classified as available-for-sale (1,843,064) (3,098,498) (4,888,918)
Purchases of property and equipment (47,359) (29,589) (27,128)
Cash paid for acquisitions (8,535) — (105,080)
Proceeds from the sale of Game Financial Corporation, net of cash sold — 15,247 —
Other investing activities (700) 428 (1,341)
Net cash provided by (used in) investing activities (62,693) (260,517) 332,316
Cash flows from financing activities:
Payments on debt — (205,182) (105,738)
Proceeds from debt — 100,000 —
Net change in revolver — 50,000 (5,000)
Proceeds and tax benefit from exercise of stock options 16,798 3,264 4,377
Preferred stock redemption — (23,895) —
Purchase of treasury stock (50,000) (16,181) (976)
Cash dividends paid (6,058) (17,408) (31,603)
Net cash used in financing activities (39,260) (109,402) (138,940)
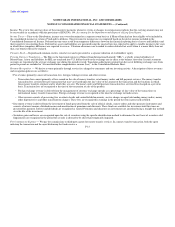
Cash flows of discontinued operations (revised — see Note 2)
Operating cash flows — 360,816 (9,041)
Investing cash flows — (6,730) (82,674)
Financing cash flows — (462,944) 80,168
Net cash used in discontinued operations — (108,858) (11,547)
Net decrease in cash and cash equivalents — (33,832) (5,293)
Cash and cash equivalents — beginning of period — 33,832 39,125
Cash and cash equivalents — end of period $ — $ — $ 33,832
See Notes to Consolidated Financial Statements
F-8