MoneyGram 2005 Annual Report Download - page 26
Download and view the complete annual report
Please find page 26 of the 2005 MoneyGram annual report below. You can navigate through the pages in the report by either clicking on the pages listed below, or by using the keyword search tool below to find specific information within the annual report.-
 1
1 -
2
-
3
-
4
-
5
-
6
-
7
-
8
-
9
-
10
-
11
-
12
-
13
-
14
-
15
-
 16
16 -
 17
17 -
 18
18 -
 19
19 -
 20
20 -
 21
21 -
 22
22 -
 23
23 -
 24
24 -
 25
25 -
 26
26 -
 27
27 -
 28
28 -
 29
29 -
 30
30 -
 31
31 -
 32
32 -
 33
33 -
 34
34 -
 35
35 -
 36
36 -
37
-
38
-
39
-
40
-
41
-
42
-
43
-
44
-
45
-
46
-
47
-
48
-
49
-
50
-
51
-
52
-
53
-
54
-
55
-
56
-
57
-
58
-
59
-
60
-
61
-
62
-
63
-
64
-
65
-
66
-
67
-
68
-
69
-
70
-
71
-
72
-
73
-
74
-
75
-
76
-
77
-
78
-
79
-
80
-
81
-
82
-
83
-
84
-
85
-
86
-
87
-
88
-
89
-
90
-
91
-
92
-
93
-
94
-
95
-
96
-
97
-
98
-
99
-
100
-
101
-
102
-
103
-
104
-
105
-
106
-
107
-
108
-
109
-
110
-
111
-
112
-
113
-
114
-
115
-
116
-
117
-
118
-
119
-
120
-
121
-
122
-
123
-
124
-
125
-
126
-
127
-
128
-
129
-
130
-
131
-
132
-
133
-
134
-
135
-
136
-
137
-
138
-
139
-
140
-
141
-
142
-
143
-
144
-
145
-
146
-
147
-
148
-
149
-
150
-
151
-
152
-
153
-
154
-
155
 |
 |

Table of Contents
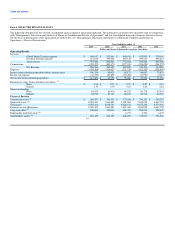
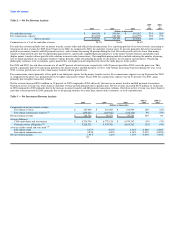
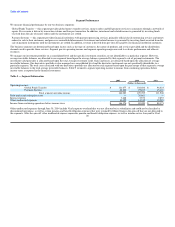
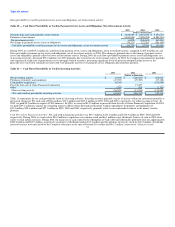
(1) Investment commissions expense includes payments made to financial institution customers based on short-term interest rate indices on the outstanding
balances of official checks sold by that financial institution, as well as costs associated with swaps and the sale of receivables program.
(2) Commissions are paid to financial institution customers based upon average outstanding balances generated by the sale of official checks only. The
average balance in the table reflects only the payment service obligations for which commissions are paid and does not include the average balance of the
sold receivables ($389.8 million, $404.6 and $428.1 million for 2005, 2004 and 2003, respectively) as these are not recorded in the Consolidated Balance
Sheets.
(3) Average yields/rates are calculated by dividing the applicable amount shown in the "Components of net investment revenue" section by the applicable
amount shown in the "Average balances" section. The "Net investment margin" is calculated by dividing "Net investment revenue" by the "Cash
equivalents and investments" average balance.
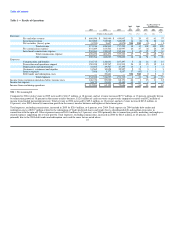
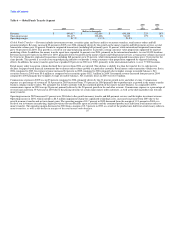
Investment revenue in 2005 increased 16 percent over 2004, primarily driven by higher yields on cash and adjustable rate securities, $12.6 million in cash
flows from previously impaired investments and $6.2 million in income from limited partnership interests. Investment revenue declined two percent in 2004
compared to 2003, primarily driven by lower average investable balances. The higher average investable balances in 2003 resulted from the unprecedented
mortgage refinancing activity that occurred during late 2002 and into 2003 due to the dramatic decline in interest rates. Refinancing activities caused an
increase in the sale of official checks and, therefore, an increase in our average investable balances. In 2004, the refinancing activity declined, causing average
investable balances to decline. The refinancing activity in 2003 also caused a significant increase in the prepayments of mortgage-backed debt securities in
our investment portfolio, the proceeds of which we reinvested at lower interest rates.
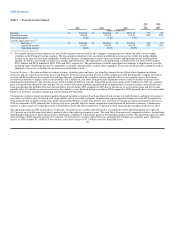
Investment commissions expense in 2005 increased nine percent over 2004, primarily due to higher short-term rates which increased the amount of
commissions paid to financial institution customers and the cost of receivables sold, partially offset by lower swap costs. Investment commissions expense in
2004 declined by five percent from 2003, primarily due to lower swap costs, partially offset by the impact of rising short-term rates. Lower swap costs are the
result of maturing high rate swaps replaced by lower rate swaps, increases in short-term rates and lower notional swap balances.
Net investment revenue increased 34 percent in 2005 compared to 2004, with the net investment margin increasing 50 basis points to 1.91 percent. During
2005, the average Fed Funds rate increased 187 basis points and the average 5-year U.S. Treasury Note increased 62 basis points. These changes in interest
rates are representative of the flat yield curve environment in which we operated in 2005. The 2005 margin benefited from the investment revenue items
discussed above, as well as the lower swap costs. Net investment revenue increased by six percent in 2004 compared to 2003, with the net investment margin
increasing 12 basis points to 1.42 percent. During 2004, the average Fed Funds rate increased 22 basis points and the average 5-year U.S. Treasury Note
increased 47 basis points. The unprecedented mortgage refinancing activity in 2003 and 2002 caused the net investment margin to fall 51 basis points in 2003,
while the 2004 net investment margins benefited from declining swap costs.
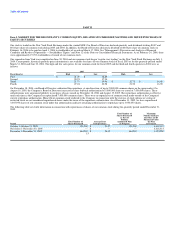
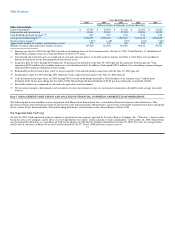
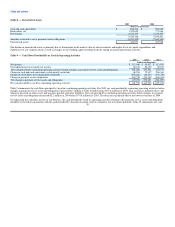
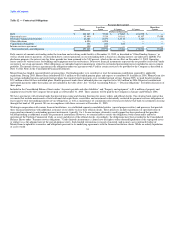
Table 4 — Summary of Gains, Losses and Impairments
2005 2004
vs vs
2005 2004 2003 2004 2003
(Dollars in thousands)
Gross realized gains $ 7,378 $ 31,903 $ 26,058 $ (24,525) $ 5,845
Gross realized losses (4,535) (6,364) (3,019) 1,829 (3,345)
Other-than-temporary impairments (6,552) (15,932) (27,917) 9,380 11,985
Net securities (losses) gains $ (3,709) $ 9,607 $ (4,878) $ (13,316) $ 14,485
23