MoneyGram 2005 Annual Report Download - page 39
Download and view the complete annual report
Please find page 39 of the 2005 MoneyGram annual report below. You can navigate through the pages in the report by either clicking on the pages listed below, or by using the keyword search tool below to find specific information within the annual report.-
 1
1 -
2
-
3
-
4
-
5
-
6
-
7
-
8
-
9
-
10
-
11
-
12
-
13
-
14
-
15
-
16
-
17
-
18
-
19
-
20
-
21
-
22
-
23
-
24
-
25
-
26
-
27
-
28
-
 29
29 -
 30
30 -
 31
31 -
 32
32 -
 33
33 -
 34
34 -
 35
35 -
 36
36 -
 37
37 -
 38
38 -
 39
39 -
 40
40 -
 41
41 -
 42
42 -
 43
43 -
 44
44 -
 45
45 -
 46
46 -
 47
47 -
 48
48 -
 49
49 -
50
-
51
-
52
-
53
-
54
-
55
-
56
-
57
-
58
-
59
-
60
-
61
-
62
-
63
-
64
-
65
-
66
-
67
-
68
-
69
-
70
-
71
-
72
-
73
-
74
-
75
-
76
-
77
-
78
-
79
-
80
-
81
-
82
-
83
-
84
-
85
-
86
-
87
-
88
-
89
-
90
-
91
-
92
-
93
-
94
-
95
-
96
-
97
-
98
-
99
-
100
-
101
-
102
-
103
-
104
-
105
-
106
-
107
-
108
-
109
-
110
-
111
-
112
-
113
-
114
-
115
-
116
-
117
-
118
-
119
-
120
-
121
-
122
-
123
-
124
-
125
-
126
-
127
-
128
-
129
-
130
-
131
-
132
-
133
-
134
-
135
-
136
-
137
-
138
-
139
-
140
-
141
-
142
-
143
-
144
-
145
-
146
-
147
-
148
-
149
-
150
-
151
-
152
-
153
-
154
-
155
 |
 |

Table of Contents
An additional component of interest rate risk is market risk that arises from fluctuations in interest rates that may result in changes in the values of
investments and swaps. Rate movements can affect the repricing of assets and liabilities differently, as well as their market value. Stockholders' equity can
also be adversely affected by changing interest rates, as after-tax changes in the fair value of securities classified as available-for-sale and after-tax changes in
the fair value of swaps are reflected as increases and decreases to a component of stockholders' equity. The fair value of our swaps generally increases when
the market value of fixed rate, long-term debt investments decline and vice versa. However, the changes in the fair value of swaps and investments may not
fully offset in stockholders' equity.
The Company's strategy in managing interest rate risk is to deliver consistent net interest margins and economic value over varying interest rate environments.
One element to our strategy is to purchase assets that have similar cash flow patterns to our payment service obligations through time and various interest rate
environments. To carry out this strategy, we purchase assets that match the average life and duration of our payment service obligations within a range that
achieves stable net interest margins. In addition, we purchase assets across a wide spectrum of average lives to achieve the desired asset duration. We also use
several different types of assets, including derivatives, to alter the average life of our assets and liabilities to match the duration of our payment service
obligations within a desired range. A second element to our strategy is to regularly assess the portfolio's exposure to changes in rates. We use a wide range of
risk measures and analyses to manage the exposure, including on-going business risk measures and analyses, run-off measures of the existing portfolio and
stress test scenarios. The two main evaluators used by the Company are net income at risk and duration gap. Net income at risk is measured using a static and
forecasted portfolio under various interest rate shock environments. Duration gap is the estimated gap between our assets and liabilities and summarizes the
extent that estimated cash flows are matched over time across various interest rate environments. The third element to our strategy is setting parameters for
rebalancing actions to help attain corporate margin objectives. Management develops rebalancing actions based upon a number of factors that include both net
investment revenue at risk and duration gap, as well as current market conditions. Internal indicators are used to determine when the risk profile of our assets
should be re-examined. As the risk measures begin to move beyond our internal indicators, we consider actions to bring them into the preferred ranges, with
an emphasis on time horizon and earnings objectives.
The Company uses derivatives as an important tool in managing interest rate risk. Derivatives are used by the Company as a hedging tool; we do not enter
into speculative trading positions. The Company typically uses interest rate swaps to hedge interest rate risk on its variable rate commission payments to
financial institution customers in its Payment Systems segment. Through these interest rate swaps, the Company can effectively convert our variable rate
commission payments to a fixed rate payment.
The Company uses net investment revenue simulation analysis and market value of equity modeling for measuring and analyzing consolidated interest rate
risk. The net investment revenue simulation analysis incorporates substantially all of the Company's interest sensitive assets and liabilities, together with
forecasted changes in the balance sheet and assumptions that reflect the current interest rate environment. The Company has previously disclosed the impact
on pre-tax income from continuing operations of changes in interest rates using a "shock" analysis, which assumes an immediate and sustained change to the
yield curve for a one-year period. In connection with changes in our internal analysis process, we will now disclose the impact on pre-tax income from
continuing operations using a "gradual ramp" analysis, under which the yield curve is assumed to increase gradually over a one-year period. We believe that
this methodology is more reflective of how yield curves actually change in rising or declining interest rate environments. As of December 31, 2005, the results
of the "shock" and "gradual ramp" analyses were not materially different. The market value of equity modeling measures the degree to which market values of
the Company's interest rate sensitive assets and liabilities will change given different interest rate scenarios. Consistent with prior disclosures, the Company
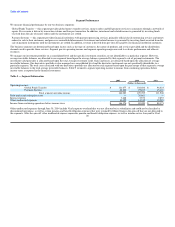
measures the impact to the market value of equity using a "shock" analysis as market value is measured at a point in time. Table 13 summarizes the changes to
our pre-tax income from continuing operations and the market value of equity under various scenarios.
36