MoneyGram 2005 Annual Report Download - page 22
Download and view the complete annual report
Please find page 22 of the 2005 MoneyGram annual report below. You can navigate through the pages in the report by either clicking on the pages listed below, or by using the keyword search tool below to find specific information within the annual report.-
 1
1 -
2
-
3
-
4
-
5
-
6
-
7
-
8
-
9
-
10
-
11
-
 12
12 -
 13
13 -
 14
14 -
 15
15 -
 16
16 -
 17
17 -
 18
18 -
 19
19 -
 20
20 -
 21
21 -
 22
22 -
 23
23 -
 24
24 -
 25
25 -
 26
26 -
 27
27 -
 28
28 -
 29
29 -
 30
30 -
 31
31 -
 32
32 -
33
-
34
-
35
-
36
-
37
-
38
-
39
-
40
-
41
-
42
-
43
-
44
-
45
-
46
-
47
-
48
-
49
-
50
-
51
-
52
-
53
-
54
-
55
-
56
-
57
-
58
-
59
-
60
-
61
-
62
-
63
-
64
-
65
-
66
-
67
-
68
-
69
-
70
-
71
-
72
-
73
-
74
-
75
-
76
-
77
-
78
-
79
-
80
-
81
-
82
-
83
-
84
-
85
-
86
-
87
-
88
-
89
-
90
-
91
-
92
-
93
-
94
-
95
-
96
-
97
-
98
-
99
-
100
-
101
-
102
-
103
-
104
-
105
-
106
-
107
-
108
-
109
-
110
-
111
-
112
-
113
-
114
-
115
-
116
-
117
-
118
-
119
-
120
-
121
-
122
-
123
-
124
-
125
-
126
-
127
-
128
-
129
-
130
-
131
-
132
-
133
-
134
-
135
-
136
-
137
-
138
-
139
-
140
-
141
-
142
-
143
-
144
-
145
-
146
-
147
-
148
-
149
-
150
-
151
-
152
-
153
-
154
-
155
 |
 |

Table of Contents
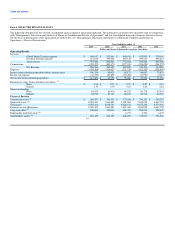
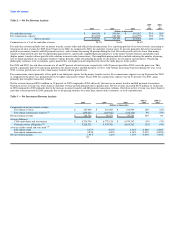
RESULTS OF OPERATIONS
Summary
Following are significant items impacting operating results from continuing operations in 2005:
• Global Funds Transfer segment revenue grew 22 percent in 2005, driven by 28 percent revenue growth in money transfer.
• Our money order transaction volume declined three percent in 2005 as expected, which is slightly less than the trend for paper-based instruments. Based on
current industry information, the trend in paper-based payment instruments is estimated to be an annual decline of five to eight percent.
• The net investment margin of 1.91 percent (see Table 3) improved over the 2004 net investment margin of 1.42 percent primarily due to $12.6 million in
cash recoveries on previously impaired securities and $6.2 million of income from limited partnership interests.
• Fee and other revenue increased 21 percent in 2005, primarily from growth in money transfer transaction volume. In addition, we recognized $2.2 million
of revenue from a payment received upon an early contract termination by a customer in the Payment Systems segment.
• Our provision for uncollectible agent receivables increased in 2005 compared to 2004 due primarily to $6.7 million in provision for a specific agent.
• Marketing expenditures increased over 50 percent as expected as we invest in our brand.
• Transaction and operations support expense includes $2.2 million of legal matters within the Global Funds Transfer segment.
• Interest expense in 2005 included the write-off of $0.9 million of unamortized deferred financing costs in connection with the amendment of our bank
credit facility.
• Our effective tax rate of 23.3 percent was down in 2005 compared to 26.8 percent in 2004 due primarily to $5.6 million of benefit recognized in
connection with changes in estimates to previously estimated tax amounts and reversal of tax reserves no longer needed due to the passage of time.
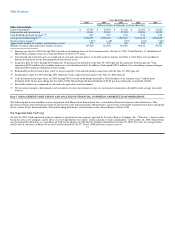
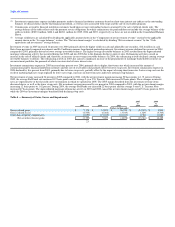
In 2005, we continued to realize strong transaction volume growth in our money transfer product (which includes our bill payment services). Money order
volumes and average investable balances declined as expected, although at a slower rate. The decline in money orders is consistent with the overall decreasing
use of paper-based instruments, while the decline in average investable balances is due to the continued consolidation of financial institutions. In 2005, we
operated in a flat yield curve environment, where short-term and long-term interest rates were almost equal. This is a challenging environment for Payment
Systems, specifically our official check business, as it puts pressure on our net investment margin by holding investment yields down while investment
commissions increase. Despite this pressure, we realized growth in our net investment margin through active management of the investment portfolio, a
successful hedging strategy and adjusting pricing to reflect the current interest rate environment as contracts with our financial institution customers come up
for renewal. The credit quality of our investment portfolio continued to improve, as evidenced by the cash recoveries on previously impaired investments and
lower impairment charges taken in 2005. In addition, the credit quality of our agent receivables remained stable from 2004, with the exception of one agent.
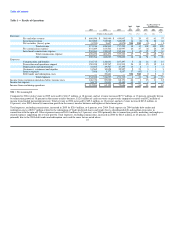
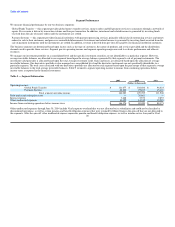
Components of Net Revenue
Our net revenue consists of fee and other revenue, investment revenue and net securities gains and losses, less commission expense. We generate net revenue
primarily by charging transaction fees in excess of third-party agent commissions, managing foreign currency exchange and managing our investments to
provide returns in excess of commissions paid to financial institution customers.
We derive revenue primarily through service fees charged to consumers and through our investments. Fee and other revenue consist of transaction fees,
foreign exchange and other revenue. Transaction fees are fees earned on the sale of money transfers, retail money order and bill payment products and official
check transactions. Money transfer transaction fees are fixed per transaction and may vary based upon the face value of the amount of the transaction and the
location in which the money transfer originates and to which it is sent. Money order and bill payment transaction fees are fixed per transaction. Foreign
exchange revenue is derived from the management of 19