MasterCard 2009 Annual Report Download - page 73
Download and view the complete annual report
Please find page 73 of the 2009 MasterCard annual report below. You can navigate through the pages in the report by either clicking on the pages listed below, or by using the keyword search tool below to find specific information within the annual report.-
 1
1 -
2
-
3
-
4
-
5
-
6
-
7
-
8
-
9
-
10
-
11
-
12
-
13
-
14
-
15
-
16
-
17
-
18
-
19
-
20
-
21
-
22
-
23
-
24
-
25
-
26
-
27
-
28
-
29
-
30
-
31
-
32
-
33
-
34
-
35
-
36
-
37
-
38
-
39
-
40
-
41
-
42
-
43
-
44
-
45
-
46
-
47
-
48
-
49
-
50
-
51
-
52
-
53
-
54
-
55
-
56
-
57
-
58
-
59
-
60
-
61
-
62
-
 63
63 -
 64
64 -
 65
65 -
 66
66 -
 67
67 -
 68
68 -
 69
69 -
 70
70 -
 71
71 -
 72
72 -
 73
73 -
 74
74 -
 75
75 -
 76
76 -
 77
77 -
 78
78 -
 79
79 -
 80
80 -
 81
81 -
 82
82 -
 83
83 -
84
-
85
-
86
-
87
-
88
-
89
-
90
-
91
-
92
-
93
-
94
-
95
-
96
-
97
-
98
-
99
-
100
-
101
-
102
-
103
-
104
-
105
-
106
-
107
-
108
-
109
-
110
-
111
-
112
-
113
-
114
-
115
-
116
-
117
-
118
-
119
-
120
-
121
-
122
-
123
-
124
-
125
-
126
-
127
-
128
-
129
-
130
-
131
-
132
-
133
-
134
-
135
-
136
-
137
-
138
-
139
-
140
-
141
-
142
-
143
-
144
-
145
-
146
-
147
-
148
-
149
-
150
-
151
-
152
-
153
-
154
-
155
-
156
 |
 |

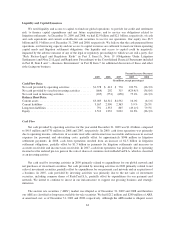
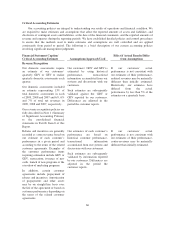
Liquidity and Capital Resources
We need liquidity and access to capital to fund our global operations; to provide for credit and settlement
risk; to finance capital expenditures and any future acquisitions; and to service our obligations related to
litigation settlements. At December 31, 2009 and 2008, we had $2.9 billion and $2.1 billion, respectively, of cash
and cash equivalents and current available-for-sale securities to use for our operations. Our equity was $3.5
billion and $1.9 billion as of December 31, 2009 and 2008, respectively. We believe that the cash generated from
operations, our borrowing capacity and our access to capital resources are sufficient to meet our future operating
capital needs and litigation settlement obligations. Our liquidity and access to capital could be negatively
impacted by the adverse outcome of any of the legal or regulatory proceedings to which we are still a party. See
“Risk Factors-Legal and Regulatory Risks” in Part I, Item 1A, Note 19 (Obligations Under Litigation
Settlements) and Note 21 (Legal and Regulatory Proceedings) to the Consolidated Financial Statements included
in Part II, Item 8 and “—Business Environment” in Part II, Item 7 for additional discussion of these and other
risks facing our business.
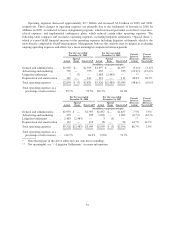
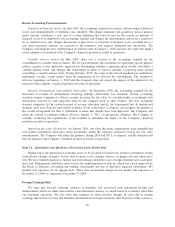
2009 2008 2007
Percent Increase (Decrease)
2009 2008
(In millions, except percentages)
Cash Flow Data:
Net cash provided by operating activities .............. $1,378 $ 413 $ 770 233.5% (46.3)%
Net cash provided by (used in) investing activities ....... (664) 202 315 (429.4)% (36.0)%
Net cash used in financing activities .................. (185) (751) (658) 75.4% (14.3)%
Balance Sheet Data:
Current assets .................................... $5,003 $4,312 $4,592 16.0% (6.1)%
Current liabilities ................................. 3,167 2,990 2,363 5.9 % 26.5%
Long-term liabilities ............................... 791 1,553 865 (49.1)% 79.5%
Equity .......................................... 3,512 1,932 3,032 81.8% (36.3)%
Cash Flow
Net cash provided by operating activities for the year ended December 31, 2009 was $1.4 billion, compared
to $413 million and $770 million in 2008 and 2007, respectively. In 2009, cash from operations was primarily
due to operating income, collections of accounts receivable and income taxes receivable and increases in accrued
expenses for personnel and advertising costs, partially offset by approximately $946 million in litigation
settlement payments. In 2008, cash from operations resulted from an increase of $2.5 billion in litigation
settlement obligations, partially offset by $1.3 billion in payments for litigation settlements and increases in
accounts receivable and income taxes receivable. In 2007, cash from operations was primarily due to operating
income less the realized pre-tax gain on the sale of shares of common stock in RedeCard S.A. which is classified
as an investing activity.
Net cash used by investing activities in 2009 primarily related to expenditures for our global network and
net purchases of investment securities. Net cash provided by investing activities in 2008 primarily related to net
sales of investment securities, partially offset by expenditures for our payment card network and an acquisition of
a business. In 2007, cash provided by investing activities was primarily due to the net sales of investment
securities, including common shares of RedeCard S.A., partially offset by expenditures for our payment card
network. We intend to continue to invest in our infrastructure to support our growing business and strategic
initiatives.
The auction rate securities (“ARS”) market was illiquid as of December 31, 2009 and 2008 and therefore
our ARS are classified as long-term available-for-sale securities. We had $212 million and $240 million of ARS,
at amortized cost, as of December 31, 2009 and 2008, respectively. Although the ARS market is illiquid, issuer
63