MasterCard 2009 Annual Report Download - page 104
Download and view the complete annual report
Please find page 104 of the 2009 MasterCard annual report below. You can navigate through the pages in the report by either clicking on the pages listed below, or by using the keyword search tool below to find specific information within the annual report.-
 1
1 -
2
-
3
-
4
-
5
-
6
-
7
-
8
-
9
-
10
-
11
-
12
-
13
-
14
-
15
-
16
-
17
-
18
-
19
-
20
-
21
-
22
-
23
-
24
-
25
-
26
-
27
-
28
-
29
-
30
-
31
-
32
-
33
-
34
-
35
-
36
-
37
-
38
-
39
-
40
-
41
-
42
-
43
-
44
-
45
-
46
-
47
-
48
-
49
-
50
-
51
-
52
-
53
-
54
-
55
-
56
-
57
-
58
-
59
-
60
-
61
-
62
-
63
-
64
-
65
-
66
-
67
-
68
-
69
-
70
-
71
-
72
-
73
-
74
-
75
-
76
-
77
-
78
-
79
-
80
-
81
-
82
-
83
-
84
-
85
-
86
-
87
-
88
-
89
-
90
-
91
-
92
-
93
-
 94
94 -
 95
95 -
 96
96 -
 97
97 -
 98
98 -
 99
99 -
 100
100 -
 101
101 -
 102
102 -
 103
103 -
 104
104 -
 105
105 -
 106
106 -
 107
107 -
 108
108 -
 109
109 -
 110
110 -
 111
111 -
 112
112 -
 113
113 -
 114
114 -
115
-
116
-
117
-
118
-
119
-
120
-
121
-
122
-
123
-
124
-
125
-
126
-
127
-
128
-
129
-
130
-
131
-
132
-
133
-
134
-
135
-
136
-
137
-
138
-
139
-
140
-
141
-
142
-
143
-
144
-
145
-
146
-
147
-
148
-
149
-
150
-
151
-
152
-
153
-
154
-
155
-
156
 |
 |

MASTERCARD INCORPORATED
NOTES TO CONSOLIDATED FINANCIAL STATEMENTS—(Continued)
(In thousands, except percent and per share data)
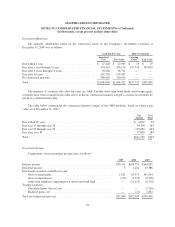
Investment Maturities:
The maturity distribution based on the contractual terms of the Company’s investment securities at
December 31, 2009 was as follows:
Available-For-Sale Held-To-Maturity
Amortized
Cost Fair Value
Carrying
Value Fair Value
Due within 1 year ................................... $ 27,420 $ 27,905 $ 19 $ 19
Due after 1 year through 5 years ........................ 374,519 393,114 337,778 339,670
Due after 5 years through 10 years ...................... 94,306 96,711 — —
Due after 10 years ................................... 207,750 176,587 — —
No contractual maturity ............................... 305,663 310,015 — —
Total ............................................. $1,009,658 $1,004,332 $337,797 $339,689
The majority of securities due after ten years are ARS. Taxable short-term bond funds and foreign equity
securities have been included in the table above in the no contractual maturity category, as these investments do
not have a stated maturity date.
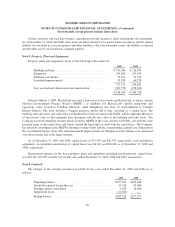
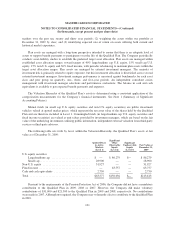
The table below summarizes the contractual maturity ranges of the ARS portfolio, based on relative par
value, as of December 31, 2009:
Par
Amount
%of
Total
Due within 10 years ........................................................... $ 4,000 2%
Due year 11 through year 20 ..................................................... 34,300 16%
Due year 21 through year 30 ..................................................... 135,850 64%
Due after year 30 .............................................................. 37,600 18%
Total ....................................................................... $211,750 100%
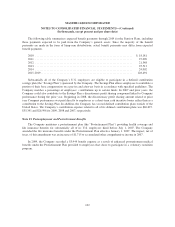
Investment Income:
Components of net investment income were as follows:
2009 2008 2007
Interest income ................................................... $55,911 $108,757 $140,851
Dividend income ................................................. 5 1,222 15,386
Investment securities available-for-sale:
Gross realized gains ........................................... 1,921 87,579 391,444
Gross realized losses .......................................... (139) (3,519) (8,298)
Other than temporary impairment on short-term bond fund ............ — (11,115) (8,719)
Trading securities:
Unrealized gains (losses), net .................................... — — (2,116)
Realized gains, net ............................................ — (17) 1,852
Total investment income, net ........................................ $57,698 $182,907 $530,400
94