MasterCard 2009 Annual Report Download - page 61
Download and view the complete annual report
Please find page 61 of the 2009 MasterCard annual report below. You can navigate through the pages in the report by either clicking on the pages listed below, or by using the keyword search tool below to find specific information within the annual report.-
 1
1 -
2
-
3
-
4
-
5
-
6
-
7
-
8
-
9
-
10
-
11
-
12
-
13
-
14
-
15
-
16
-
17
-
18
-
19
-
20
-
21
-
22
-
23
-
24
-
25
-
26
-
27
-
28
-
29
-
30
-
31
-
32
-
33
-
34
-
35
-
36
-
37
-
38
-
39
-
40
-
41
-
42
-
43
-
44
-
45
-
46
-
47
-
48
-
49
-
50
-
 51
51 -
 52
52 -
 53
53 -
 54
54 -
 55
55 -
 56
56 -
 57
57 -
 58
58 -
 59
59 -
 60
60 -
 61
61 -
 62
62 -
 63
63 -
 64
64 -
 65
65 -
 66
66 -
 67
67 -
 68
68 -
 69
69 -
 70
70 -
 71
71 -
72
-
73
-
74
-
75
-
76
-
77
-
78
-
79
-
80
-
81
-
82
-
83
-
84
-
85
-
86
-
87
-
88
-
89
-
90
-
91
-
92
-
93
-
94
-
95
-
96
-
97
-
98
-
99
-
100
-
101
-
102
-
103
-
104
-
105
-
106
-
107
-
108
-
109
-
110
-
111
-
112
-
113
-
114
-
115
-
116
-
117
-
118
-
119
-
120
-
121
-
122
-
123
-
124
-
125
-
126
-
127
-
128
-
129
-
130
-
131
-
132
-
133
-
134
-
135
-
136
-
137
-
138
-
139
-
140
-
141
-
142
-
143
-
144
-
145
-
146
-
147
-
148
-
149
-
150
-
151
-
152
-
153
-
154
-
155
-
156
 |
 |

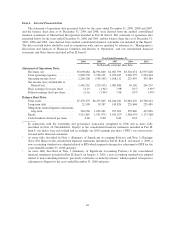
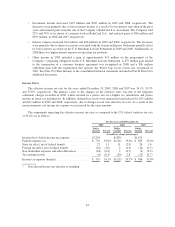
Financial Results
As part of a review of its presentation of certain financial information, during 2009, the Company:
(1) modified its presentation of details of the Company’s major revenue categories included within the
Management’s Discussion and Analysis of Financial Condition and Results of Operations (the “MD&A”) section
of filings with the U.S. Securities and Exchange Commission (the “SEC”) and (2) reclassified certain cardholder-
related enhancement expenses. In each case, the Company’s intent was to better align such information with the
way in which management views the underlying drivers of the business and analyzes the Company’s results of
operations. The modifications to the presentation within the MD&A of the detail of the Company’s revenue
categories did not result in any changes to the Company’s historical financial statements and had no effect on the
overall calculation of net revenue presented in the financial statements. The reclassification of certain cardholder-
related enhancement expenses did not result in any impact to the Company’s overall operating expenses. See “—
Operating Expenses” for more information.
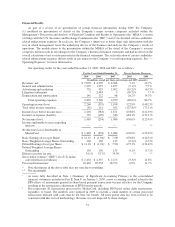
Our operating results for the years ended December 31, 2009, 2008 and 2007, are as follows:
For the Years Ended December 31, Percent Increase (Decrease)
2009 2008 2007 2009 2008
(In millions, except per share, percentages and GDV amounts)
Revenues, net ............................ $ 5,099 $ 4,992 $ 4,068 2.1% 22.7%
General and administrative ................. 1,935 1,997 1,857 (3.1)% 7.5 %
Advertising and marketing ................. 755 935 1,002 (19.2)% (6.7)%
Litigation settlements ..................... 7 2,483 3 (99.7)% ** %
Depreciation and amortization ............... 141 112 98 26.2% 14.7%
Total operating expenses ............... 2,839 5,526 2,959 (48.6)% 86.7%
Operating income (loss) .................... 2,260 (535) 1,108 522.8% (148.2)%
Total other income (expense) ............... (42) 151 563 (127.8)% (73.1)%
Income (loss) before income taxes ........... 2,218 (383) 1,671 678.8% (122.9)%
Income tax expense (benefit) ................ 755 (129) 586 684.3% (122.1)%
Net income (loss) ......................... 1,463 (254) 1,086 676.0% (123.4)%
Income attributable to non-controlling
interests .............................. — — — ** **
Net Income (Loss) Attributable to
MasterCard ........................... $ 1,463 $ (254) $ 1,086 676.0% (123.4)%
Basic Earnings (Loss) per Share1............ $ 11.19 $ (1.94)1$ 7.981676.8% (124.3)%
Basic Weighted Average Shares Outstanding . . . 130 130 135 (0.2)% (3.5)%
Diluted Earnings (Loss) per Share1........... $ 11.16 $ (1.94)1$ 7.961675.3% (124.4)%
Diluted Weighted Average Shares
Outstanding ........................... 130 130 135 0.1% (3.7)%
Effective income tax rate ................... 34.1% 33.7% 35.0% ** **
Gross dollar volume (“GDV”) on a U.S. dollar
converted basis (in billions) ............... $ 2,454 $ 2,537 $ 2,273 (3.3)% 11.6%
Processed transactions2.................... 22,410 20,954 18,752 6.9% 11.7%
* Note that figures in the above table may not sum due to rounding.
** Not meaningful.
1As more fully described in Note 1 (Summary of Significant Accounting Policies) to the consolidated
financial statements included in Part II, Item 8, on January 1, 2009, a new accounting standard related to the
EPS effects of instruments granted in share-based payment transactions became effective for the Company
resulting in the retrospective adjustment of EPS for prior periods.
2Data represents all transactions processed by MasterCard, including PIN-based online debit transactions,
regardless of brand. The numbers were updated in 2009 to exclude a small number of certain processed
transactions initiated with cards that do not bear our brands. All prior period data has been revised to be
consistent with this revised methodology. Revenue was not impacted by these changes.
51