MasterCard 2009 Annual Report Download - page 58
Download and view the complete annual report
Please find page 58 of the 2009 MasterCard annual report below. You can navigate through the pages in the report by either clicking on the pages listed below, or by using the keyword search tool below to find specific information within the annual report.-
 1
1 -
2
-
3
-
4
-
5
-
6
-
7
-
8
-
9
-
10
-
11
-
12
-
13
-
14
-
15
-
16
-
17
-
18
-
19
-
20
-
21
-
22
-
23
-
24
-
25
-
26
-
27
-
28
-
29
-
30
-
31
-
32
-
33
-
34
-
35
-
36
-
37
-
38
-
39
-
40
-
41
-
42
-
43
-
44
-
45
-
46
-
47
-
 48
48 -
 49
49 -
 50
50 -
 51
51 -
 52
52 -
 53
53 -
 54
54 -
 55
55 -
 56
56 -
 57
57 -
 58
58 -
 59
59 -
 60
60 -
 61
61 -
 62
62 -
 63
63 -
 64
64 -
 65
65 -
 66
66 -
 67
67 -
 68
68 -
69
-
70
-
71
-
72
-
73
-
74
-
75
-
76
-
77
-
78
-
79
-
80
-
81
-
82
-
83
-
84
-
85
-
86
-
87
-
88
-
89
-
90
-
91
-
92
-
93
-
94
-
95
-
96
-
97
-
98
-
99
-
100
-
101
-
102
-
103
-
104
-
105
-
106
-
107
-
108
-
109
-
110
-
111
-
112
-
113
-
114
-
115
-
116
-
117
-
118
-
119
-
120
-
121
-
122
-
123
-
124
-
125
-
126
-
127
-
128
-
129
-
130
-
131
-
132
-
133
-
134
-
135
-
136
-
137
-
138
-
139
-
140
-
141
-
142
-
143
-
144
-
145
-
146
-
147
-
148
-
149
-
150
-
151
-
152
-
153
-
154
-
155
-
156
 |
 |
Overview
MasterCard is a leading global payment solutions company that provides a variety of services in support of
the credit, debit and related payment programs of approximately 23,000 financial institutions and other entities
that are our customers. We develop and market payment solutions, process payment transactions, and provide
support services to our customers and, depending upon the service, to merchants and other clients. We manage a
family of well-known, widely accepted payment card brands, including MasterCard®, MasterCard Electronic™,
Maestro®and Cirrus®, which we license to our customers. As part of managing these brands, we also establish
and enforce rules and standards surrounding the use of our payment card network. We generate revenues from
the fees that we charge our customers for providing transaction processing and other payment-related services
and by assessing our customers based primarily on the dollar volume of activity on the cards that carry our
brands. Cardholder and merchant relationships are managed principally by our customers. Accordingly, we do
not issue cards, extend credit to cardholders, determine the interest rates (if applicable) or other fees charged to
cardholders by issuers, or establish the merchant discount charged by acquirers in connection with the acceptance
of cards that carry our brands.
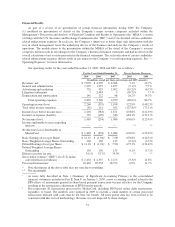
We recorded net income of $1.5 billion, or $11.16 per diluted share, in 2009 versus a net loss of $254
million, or ($1.94) per diluted share, in 2008 and net income of $1.1 billion, or $7.96 per diluted share, in 2007.
As of December 31, 2009, our liquidity and capital positions remained strong, with $2.9 billion in cash and cash
equivalents and current available-for-sale securities and $3.5 billion in equity. In addition, we generated cash
flows from operations of $1.4 billion in the year ended December 31, 2009.
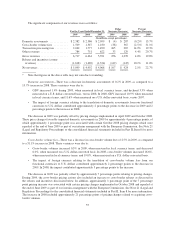
Our net revenues increased 2.1% in 2009, primarily due to increased transactions, pricing changes and
increases in the volume of activity on cards carrying our brands, partially offset by approximately 1.8 percentage
points relating to the U.S. dollar average exchange rates strengthening versus the euro and Brazilian real average
exchange rates. Historically, we experienced greater growth in net revenues than the revenue growth in 2009.
Revenue growth in 2008 was 22.7%.
Our lower revenue growth rate primarily reflects the impact of the present global economic environment,
which is negatively affecting our customers and their cardholders. Our revenues depend heavily upon the overall
level of consumer, business and government spending. Changes in cardholder spending behavior, influenced in
2009 by recessionary environments and rising unemployment, have impacted and may continue to impact our
ability to grow our revenues. Our revenues are primarily based on volumes and transactions. Our volumes are
impacted by the number of transactions and the dollar amount of each transaction. During 2009, our processed
transactions increased 6.9%; however, our volumes only increased 1.4% on a local currency converted basis and
therefore the average amount per transaction declined. In 2009, volume-based revenues (domestic assessments
and cross-border volume fees) decreased compared to 2008 and transaction-based revenues (transaction
processing fees) increased in 2009. During 2008, our processed transactions increased 11.7% and volumes on a
local currency basis increased 10.9%.
During 2009, net pricing actions contributed approximately 6 percentage points to our net revenue growth.
These net pricing actions included price increases in April 2009 and October 2009 partially offset by an increase
in cross-border rebates and the repeal of pricing relating to our interim arrangement with the European
Commission. Overall, revenue growth was moderated by an increase in rebates and incentives relating to
customer and merchant agreement activity and an increase to cross-border rebates to encourage certain behaviors
of customers. Rebates and incentives as a percentage of gross revenues were 24.1%, 22.7% and 24.6% in 2009,
2008 and 2007, respectively.
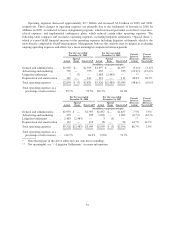
Our operating expenses decreased 48.6% in 2009, compared to 2008, primarily due to lower litigation
settlements. Excluding the impact of special items specifically identified in the reconciliation table included in
“—Operating Expenses”, operating expenses declined 6.9% in 2009 compared to 2008. In 2009, we realigned
our resources and implemented contingency plans in response to the current global economic and business
48