MasterCard 2009 Annual Report Download - page 2
Download and view the complete annual report
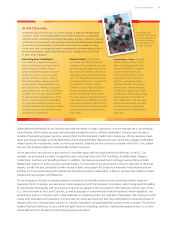
Please find page 2 of the 2009 MasterCard annual report below. You can navigate through the pages in the report by either clicking on the pages listed below, or by using the keyword search tool below to find specific information within the annual report.-
 1
1 -
 2
2 -
 3
3 -
 4
4 -
 5
5 -
 6
6 -
 7
7 -
 8
8 -
 9
9 -
 10
10 -
 11
11 -
 12
12 -
 13
13 -
14
-
15
-
16
-
17
-
18
-
19
-
20
-
21
-
22
-
23
-
24
-
25
-
26
-
27
-
28
-
29
-
30
-
31
-
32
-
33
-
34
-
35
-
36
-
37
-
38
-
39
-
40
-
41
-
42
-
43
-
44
-
45
-
46
-
47
-
48
-
49
-
50
-
51
-
52
-
53
-
54
-
55
-
56
-
57
-
58
-
59
-
60
-
61
-
62
-
63
-
64
-
65
-
66
-
67
-
68
-
69
-
70
-
71
-
72
-
73
-
74
-
75
-
76
-
77
-
78
-
79
-
80
-
81
-
82
-
83
-
84
-
85
-
86
-
87
-
88
-
89
-
90
-
91
-
92
-
93
-
94
-
95
-
96
-
97
-
98
-
99
-
100
-
101
-
102
-
103
-
104
-
105
-
106
-
107
-
108
-
109
-
110
-
111
-
112
-
113
-
114
-
115
-
116
-
117
-
118
-
119
-
120
-
121
-
122
-
123
-
124
-
125
-
126
-
127
-
128
-
129
-
130
-
131
-
132
-
133
-
134
-
135
-
136
-
137
-
138
-
139
-
140
-
141
-
142
-
143
-
144
-
145
-
146
-
147
-
148
-
149
-
150
-
151
-
152
-
153
-
154
-
155
-
156
 |
 |

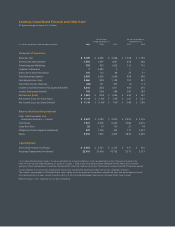
Summary Consolidated Financial and Other Data*
All fi gures throughout report in U.S. dollars
(1) As more fully described in Note 1 (Summary of Significant Accounting Policies) to the consolidated financial statements included in the
Form 10-K for the year ended December 31, 2009, on January 1, 2009, a new accounting standard related to the EPS effects of instruments
granted in share-based payment transactions became effective for the Company resulting in the retrospective adjustment of EPS for prior periods.
(2) Data represents all transactions processed by MasterCard, including PIN-based online debit transactions, regardless of brand.
The numbers were updated in 2009 to exclude a small number of certain processed transactions initiated with cards that do not bear our brands.
All prior period data has been revised to be consistent with this revised methodology. Revenue was not impacted by these changes.
*Note that figures in this table may not sum due to rounding.
For the Years For the Three Months
Ended December 31 Ended March 31
(In millions except per-share and operating data) 2009 2008 2007 2010 2009
Statement of Operations
Revenues, Net $ 5,099 $ 4,992 $ 4,068 $ 1,308 $ 1,156
General and Administrative 1,935 1,997 1,857 458 448
Advertising and Marketing 755 935 1,002 115 116
Litigation Settlements 7 2,483 3 — —
Depreciation and Amortization 141 112 98 35 31
Total Operating Expenses 2,839 5,526 2,959 608 595
Operating Income (Loss) 2,260 (535) 1,108 700 561
Total Other Income (Expense) (42) 151 563 (5) (11)
Income (Loss) before Income Tax Expense (Benefi t) 2,218 (383) 1,671 695 550
Income Tax Expense (Benefi t) 755 (129) 586 240 183
Net Income (Loss) $ 1,463 $ (254) $ 1,086 $ 455 $ 367
Net Income (Loss) per Share (Basic) $ 11.19 $ (1.94)1 $ 7.981 $ 3.47 $ 2.81
Net Income (Loss) per Share (Diluted) $ 11.16 $ (1.94)1 $ 7.961 $ 3.46 $ 2.80
Balance Sheet Data (at period end)
Cash, Cash Equivalents and
Investment Securities — Current $ 2,879 $ 2,093 $ 2,970 $ 2,950 $ 2,276
Total Assets 7,470 6,476 6,260 7,286 6,415
Long-Term Debt 22 19 150 21 18
Obligations Under Litigation Settlements 870 1,736 404 731 1,610
Equity 3,512 1,932 3,032 3,832 2,229
Operating Data
Gross Dollar Volume (in billions) $ 2,454 $ 2,537 $ 2,273 $ 631 $ 550
Processed Transactions (in millions)
2 22,410 20,954 18,752 5,373 5,137