MasterCard 2009 Annual Report Download - page 111
Download and view the complete annual report
Please find page 111 of the 2009 MasterCard annual report below. You can navigate through the pages in the report by either clicking on the pages listed below, or by using the keyword search tool below to find specific information within the annual report.-
 1
1 -
2
-
3
-
4
-
5
-
6
-
7
-
8
-
9
-
10
-
11
-
12
-
13
-
14
-
15
-
16
-
17
-
18
-
19
-
20
-
21
-
22
-
23
-
24
-
25
-
26
-
27
-
28
-
29
-
30
-
31
-
32
-
33
-
34
-
35
-
36
-
37
-
38
-
39
-
40
-
41
-
42
-
43
-
44
-
45
-
46
-
47
-
48
-
49
-
50
-
51
-
52
-
53
-
54
-
55
-
56
-
57
-
58
-
59
-
60
-
61
-
62
-
63
-
64
-
65
-
66
-
67
-
68
-
69
-
70
-
71
-
72
-
73
-
74
-
75
-
76
-
77
-
78
-
79
-
80
-
81
-
82
-
83
-
84
-
85
-
86
-
87
-
88
-
89
-
90
-
91
-
92
-
93
-
94
-
95
-
96
-
97
-
98
-
99
-
100
-
 101
101 -
 102
102 -
 103
103 -
 104
104 -
 105
105 -
 106
106 -
 107
107 -
 108
108 -
 109
109 -
 110
110 -
 111
111 -
 112
112 -
 113
113 -
 114
114 -
 115
115 -
 116
116 -
 117
117 -
 118
118 -
 119
119 -
 120
120 -
 121
121 -
122
-
123
-
124
-
125
-
126
-
127
-
128
-
129
-
130
-
131
-
132
-
133
-
134
-
135
-
136
-
137
-
138
-
139
-
140
-
141
-
142
-
143
-
144
-
145
-
146
-
147
-
148
-
149
-
150
-
151
-
152
-
153
-
154
-
155
-
156
 |
 |

MASTERCARD INCORPORATED
NOTES TO CONSOLIDATED FINANCIAL STATEMENTS—(Continued)
(In thousands, except percent and per share data)
markets over the past ten, twenty and thirty year periods; (2) weighting the assets within our portfolio at
December 31, 2009 by class; and (3) identifying expected rate of return on assets utilizing both current and
historical market experience.
Plan assets are managed with a long-term perspective intended to ensure that there is an adequate level of
assets to support benefit payments to participants over the life of the Qualified Plan. The Company periodically
conducts asset-liability studies to establish the preferred target asset allocation. Plan assets are managed within
established asset allocation ranges, toward targets of 40% large/medium cap U.S. equity, 15% small cap U.S.
equity, 15% non-U.S. equity and 30% fixed income, with periodic rebalancing to maintain plan assets within the
target asset allocation ranges. Plan assets are managed by external investment managers. The majority of
investment risk is primarily related to equity exposure, but this investment allocation is diversified across several
external investment managers. Investment manager performance is measured against benchmarks for each asset
class and peer group on quarterly, one-, three- and five-year periods. An independent consultant assists
management with investment manager selections and performance evaluations. The balance in cash and cash
equivalents is available to pay expected benefit payments and expenses.
The Valuation Hierarchy of the Qualified Plan’s assets is determined using a consistent application of the
categorization measurements for the Company’s financial instruments. See Note 1 (Summary of Significant
Accounting Policies).
Mutual funds (in small cap U.S. equity securities and non-U.S. equity securities) are public investment
vehicles valued at quoted market prices, which represent the net asset value of the shares held by the Qualified
Plan and are therefore included in Level 1. Commingled funds (in large/medium cap U.S. equity securities and
fixed income securities) are valued at unit values provided by investment managers, which are based on the fair
value of the underlying investments utilizing public information, independent external valuation from third-party
services or third-party advisors.
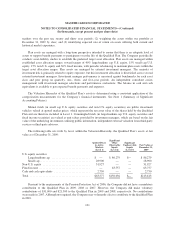
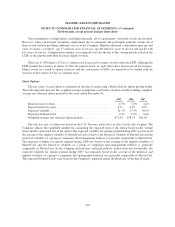
The following table sets forth by level, within the Valuation Hierarchy, the Qualified Plan’s assets at fair
value as of December 31, 2009:
Quoted Prices
in Active
Markets
(Level 1)
Significant
Other
Observable
Inputs
(Level 2)
Significant
Unobservable
Inputs
(Level 3)
Fair Value at
December 31,
2009
U.S. equity securities
Large/medium cap ........................... $ — $ 86,279 $— $ 86,279
Small cap ................................... 28,900 — — 28,900
Non-U.S. equity ................................. 31,927 — — 31,927
Fixed income .................................... — 63,757 — 63,757
Cash and cash equivalents ......................... 2,750 — — 2,750
Total .......................................... $63,577 $150,036 $— $213,613
Pursuant to the requirements of the Pension Protection Act of 2006, the Company did not have a mandatory
contribution to the Qualified Plan in 2009, 2008 or 2007. However, the Company did make voluntary
contributions of $31,000 and $21,500 to the Qualified Plan in 2009 and 2008, respectively. No contributions
were made in 2007. Although not required, the Company may voluntarily elect to contribute to the Qualified Plan
in 2010.
101