MasterCard 2009 Annual Report Download - page 66
Download and view the complete annual report
Please find page 66 of the 2009 MasterCard annual report below. You can navigate through the pages in the report by either clicking on the pages listed below, or by using the keyword search tool below to find specific information within the annual report.-
 1
1 -
2
-
3
-
4
-
5
-
6
-
7
-
8
-
9
-
10
-
11
-
12
-
13
-
14
-
15
-
16
-
17
-
18
-
19
-
20
-
21
-
22
-
23
-
24
-
25
-
26
-
27
-
28
-
29
-
30
-
31
-
32
-
33
-
34
-
35
-
36
-
37
-
38
-
39
-
40
-
41
-
42
-
43
-
44
-
45
-
46
-
47
-
48
-
49
-
50
-
51
-
52
-
53
-
54
-
55
-
 56
56 -
 57
57 -
 58
58 -
 59
59 -
 60
60 -
 61
61 -
 62
62 -
 63
63 -
 64
64 -
 65
65 -
 66
66 -
 67
67 -
 68
68 -
 69
69 -
 70
70 -
 71
71 -
 72
72 -
 73
73 -
 74
74 -
 75
75 -
 76
76 -
77
-
78
-
79
-
80
-
81
-
82
-
83
-
84
-
85
-
86
-
87
-
88
-
89
-
90
-
91
-
92
-
93
-
94
-
95
-
96
-
97
-
98
-
99
-
100
-
101
-
102
-
103
-
104
-
105
-
106
-
107
-
108
-
109
-
110
-
111
-
112
-
113
-
114
-
115
-
116
-
117
-
118
-
119
-
120
-
121
-
122
-
123
-
124
-
125
-
126
-
127
-
128
-
129
-
130
-
131
-
132
-
133
-
134
-
135
-
136
-
137
-
138
-
139
-
140
-
141
-
142
-
143
-
144
-
145
-
146
-
147
-
148
-
149
-
150
-
151
-
152
-
153
-
154
-
155
-
156
 |
 |
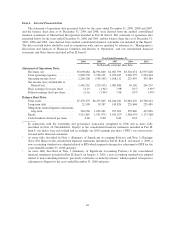
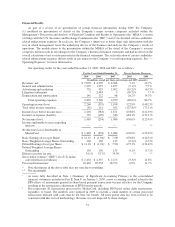
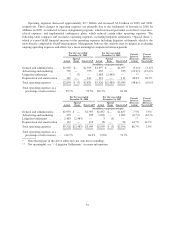
Transaction processing fees—The increases in transaction processing fees of 14.9% and 19.3% during 2009
and 2008, respectively, were due to:
• Pricing changes which represented approximately 8 percentage points of the increase in 2009.
• Processed transactions increased 6.9% and 11.7% during 2009 and 2008, respectively.
• The impact of foreign currency relating to the translation of transaction processing fees from our functional
currencies to U.S. dollars offset the 2009 increase by approximately 2 percentage points. In 2008, the impact
contributed approximately 2 percentage points to the increase.
Other revenues—The increases in 2009 and 2008 of 4.4% and 20.7%, respectively, were offset by
approximately 1 percentage point and contributed approximately 2 percentage points to the increase,
respectively, for the impact of foreign currency relating to the translation of other revenues from our functional
currencies to U.S. dollars. Additionally:
• In 2009 compared to 2008, there were increased fees for compliance and penalty fees, implementation
fees, cardholder services fees and fraud products and services partially offset by a decline in consulting
and research fees.
• In 2008 compared to 2007, there were increased fees for account and transaction enhancement services
and cardholder service fees.
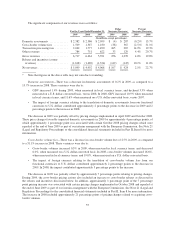
Rebates and incentives—Rebates and incentives increased 10.1% in 2009 and 11.0% in 2008. Rebates and
incentives as a percentage of gross revenues were 24.1%, 22.7% and 24.6% in 2009, 2008 and 2007,
respectively. The amount of rebates and incentives increased due to the following:
• Greater rebates and incentives for certain new and renewed agreements, some of which included
shorter performance periods for specific customers. We intend to continue to enter into and maintain
business agreements with certain customers and merchants that provide rebates and incentives.
• In 2009, cross-border pricing actions included an increase to a cross-border rebate to encourage certain
behaviors of our customers. The increase in this cross-border rebate contributed approximately 3
percentage points to the increase in rebates and incentives.
• The impact of foreign currency relating to the translation of rebates and incentives from our functional
currencies to U.S. dollars offset the increase by approximately 1 percentage point and contributed 1
percentage point to the increase in 2009 and 2008, respectively.
These increases were partially offset by:
• Reduced estimates for rebates and incentives for certain customers which did not achieve contractual
performance hurdles.
• In 2009, lower cross-border rebates due to a decline in cross-border volume growth and less marketing
activity with merchants.
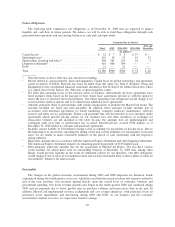
Operating Expenses
Our operating expenses are comprised of general and administrative, advertising and marketing, litigation
settlements and depreciation and amortization expenses. During 2009, the Company reclassified certain
cardholder-related enhancement expenses, which were previously classified as advertising and marketing
expenses, to general and administrative expenses. These cardholder benefit programs, such as insurance and card
replacements, were previously deemed promotional features of the cards and over time have become standard
product offerings in certain card categories. Approximately $83 million and $79 million of these expenses have
been reclassified in 2008 and 2007, respectively, to conform to the 2009 presentation.
56