MasterCard 2009 Annual Report Download - page 65
Download and view the complete annual report
Please find page 65 of the 2009 MasterCard annual report below. You can navigate through the pages in the report by either clicking on the pages listed below, or by using the keyword search tool below to find specific information within the annual report.-
 1
1 -
2
-
3
-
4
-
5
-
6
-
7
-
8
-
9
-
10
-
11
-
12
-
13
-
14
-
15
-
16
-
17
-
18
-
19
-
20
-
21
-
22
-
23
-
24
-
25
-
26
-
27
-
28
-
29
-
30
-
31
-
32
-
33
-
34
-
35
-
36
-
37
-
38
-
39
-
40
-
41
-
42
-
43
-
44
-
45
-
46
-
47
-
48
-
49
-
50
-
51
-
52
-
53
-
54
-
 55
55 -
 56
56 -
 57
57 -
 58
58 -
 59
59 -
 60
60 -
 61
61 -
 62
62 -
 63
63 -
 64
64 -
 65
65 -
 66
66 -
 67
67 -
 68
68 -
 69
69 -
 70
70 -
 71
71 -
 72
72 -
 73
73 -
 74
74 -
 75
75 -
76
-
77
-
78
-
79
-
80
-
81
-
82
-
83
-
84
-
85
-
86
-
87
-
88
-
89
-
90
-
91
-
92
-
93
-
94
-
95
-
96
-
97
-
98
-
99
-
100
-
101
-
102
-
103
-
104
-
105
-
106
-
107
-
108
-
109
-
110
-
111
-
112
-
113
-
114
-
115
-
116
-
117
-
118
-
119
-
120
-
121
-
122
-
123
-
124
-
125
-
126
-
127
-
128
-
129
-
130
-
131
-
132
-
133
-
134
-
135
-
136
-
137
-
138
-
139
-
140
-
141
-
142
-
143
-
144
-
145
-
146
-
147
-
148
-
149
-
150
-
151
-
152
-
153
-
154
-
155
-
156
 |
 |

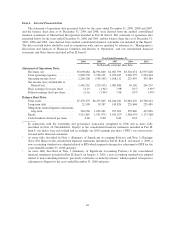
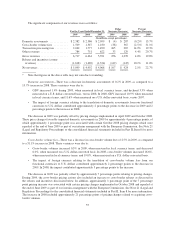
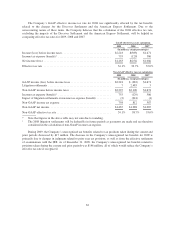
The significant components of our revenues were as follows:
For the Years Ended December 31,
Dollar
Increase (Decrease)
Percent
Increase (Decrease)
2009 2008 2007 2009 2008 2009 2008
(In millions, except percentages)
Domestic assessments ............. $2,382 $ 2,386 $ 2,099 $ (4) $ 287 (0.2)% 13.7%
Cross-border volume fees .......... 1,509 1,547 1,180 (38) 367 (2.5)% 31.1%
Transaction processing fees ......... 2,042 1,777 1,490 265 287 14.9% 19.3%
Other revenues ................... 784 751 622 33 129 4.4% 20.7%
Gross revenues ................... 6,717 6,461 5,391 256 1,070 4.0% 19.8%
Rebates and incentives (contra-
revenues) ..................... (1,618) (1,469) (1,324) (149) (145) 10.1% 11.0%
Net revenues ..................... $5,099 $ 4,992 $ 4,068 $ 107 $ 924 2.1% 22.7%
* Note that figures in the above table may not sum due to rounding.
Domestic assessments—There was a decrease in domestic assessments of 0.2% in 2009, as compared to a
13.7% increase in 2008. These variances were due to:
• GDV increased 1.4% during 2009, when measured in local currency terms, and declined 3.3% when
measured on a U.S. dollar-converted basis, versus 2008. In 2008, GDV increased 10.9% when measured
in local currency terms, and 11.6% when measured on a U.S. dollar-converted basis, versus 2007.
• The impact of foreign currency relating to the translation of domestic assessments from our functional
currencies to U.S. dollars contributed approximately 2 percentage points to the decrease in 2009 and 2
percentage points to the increase in 2008.
The decrease in 2009 was partially offset by pricing changes implemented in April 2009 and October 2008.
These price changes favorably impacted domestic assessments in 2009 by approximately 4 percentage points, of
which approximately 1 percentage point was associated with certain October 2008 pricing changes which were
repealed at the end of June 2009 as part of our interim arrangement with the European Commission. See Note 21
(Legal and Regulatory Proceedings) to the consolidated financial statements included in Part II, Item 8 for more
information.
Cross-border volume fees—There was a decrease in cross-border volume fees of 2.5% in 2009, as compared
to a 31.1% increase in 2008. These variances were due to:
• Cross-border volumes increased 0.3% in 2009, when measured in local currency terms, and decreased
6.0%, when measured on a U.S. dollar-converted basis. In 2008, cross-border volumes increased 16.6%,
when measured in local currency terms, and 19.0%, when measured on a U.S. dollar-converted basis.
• The impact of foreign currency relating to the translation of cross-border volume fees from our
functional currencies to U.S. dollars contributed approximately 2 percentage points to the decrease in
2009. In 2008, the impact contributed approximately 3 percentage points to the increase.
The decrease in 2009 was partially offset by approximately 7 percentage points relating to pricing changes.
During 2009, the cross-border pricing actions also included an increase to cross-border rebates as discussed in
the rebates and incentives discussion below. In addition, approximately 1 percentage point of the 7 percentage
point pricing increase was associated with certain pricing changes implemented in October 2008 and repealed at
the end of June 2009 as part of our interim arrangement with the European Commission. See Note 21 (Legal and
Regulatory Proceedings) to the consolidated financial statements included in Part II, Item 8 for more information.
The increase in 2008 included approximately 21 percentage points of pricing changes related to acquiring cross-
border volumes.
55