MasterCard 2009 Annual Report Download - page 67
Download and view the complete annual report
Please find page 67 of the 2009 MasterCard annual report below. You can navigate through the pages in the report by either clicking on the pages listed below, or by using the keyword search tool below to find specific information within the annual report.-
 1
1 -
2
-
3
-
4
-
5
-
6
-
7
-
8
-
9
-
10
-
11
-
12
-
13
-
14
-
15
-
16
-
17
-
18
-
19
-
20
-
21
-
22
-
23
-
24
-
25
-
26
-
27
-
28
-
29
-
30
-
31
-
32
-
33
-
34
-
35
-
36
-
37
-
38
-
39
-
40
-
41
-
42
-
43
-
44
-
45
-
46
-
47
-
48
-
49
-
50
-
51
-
52
-
53
-
54
-
55
-
56
-
 57
57 -
 58
58 -
 59
59 -
 60
60 -
 61
61 -
 62
62 -
 63
63 -
 64
64 -
 65
65 -
 66
66 -
 67
67 -
 68
68 -
 69
69 -
 70
70 -
 71
71 -
 72
72 -
 73
73 -
 74
74 -
 75
75 -
 76
76 -
 77
77 -
78
-
79
-
80
-
81
-
82
-
83
-
84
-
85
-
86
-
87
-
88
-
89
-
90
-
91
-
92
-
93
-
94
-
95
-
96
-
97
-
98
-
99
-
100
-
101
-
102
-
103
-
104
-
105
-
106
-
107
-
108
-
109
-
110
-
111
-
112
-
113
-
114
-
115
-
116
-
117
-
118
-
119
-
120
-
121
-
122
-
123
-
124
-
125
-
126
-
127
-
128
-
129
-
130
-
131
-
132
-
133
-
134
-
135
-
136
-
137
-
138
-
139
-
140
-
141
-
142
-
143
-
144
-
145
-
146
-
147
-
148
-
149
-
150
-
151
-
152
-
153
-
154
-
155
-
156
 |
 |

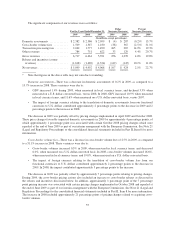
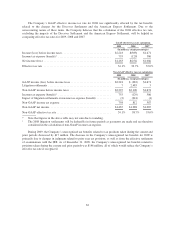
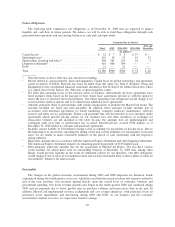
Operating expenses decreased approximately $2.7 billion and increased $2.6 billion in 2009 and 2008,
respectively. These changes in operating expenses are primarily due to the settlements of lawsuits in 2008. In
addition, in 2009, we initiated resource realignment programs, which increased personnel costs due to severance-
related expenses, and implemented contingency plans, which reduced certain other operating expenses. The
following table compares and reconciles operating expenses, excluding litigation settlements (“Special Items”),
which is a non-GAAP financial measure to the operating expenses including litigation settlements, which is the
most directly comparable GAAP measurement. Management believes this analysis may be helpful in evaluating
ongoing operating expenses and allows for a more meaningful comparison between periods.
For the year ended
December 31, 2009
For the year ended
December 31, 2008 Percent
Increase
(Decrease)
Actual
Percent
Increase
(Decrease)
Non-GAAPActual
Special
Items Non-GAAP Actual
Special
Items Non-GAAP
(In millions, except percentages)
General and administrative ..... $1,935 $— $1,935 $1,997 $ — $1,997 (3.1)% (3.1)%
Advertising and marketing ..... 755 — 755 935 — 935 (19.2)% (19.2)%
Litigation settlements ......... 7 (7) — 2,483 (2,483) — ** —
Depreciation and amortization . . 141 — 141 112 — 112 26.2% 26.2%
Total operating expenses ...... $2,839 $ (7) $2,831 $5,526 $(2,483) $3,043 (48.6)% (6.9)%
Total operating expenses as a
percentage of net revenues . . . 55.7% 55.5% 110.7% 61.0%
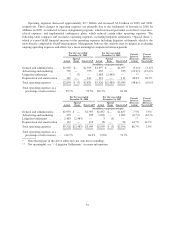
For the year ended
December 31, 2008
For the year ended
December 31, 2007 Percent
Increase
(Decrease)
Actual
Percent
Increase
(Decrease)
Non-GAAPActual
Special
Items Non-GAAP Actual
Special
Items Non-GAAP
(In millions, except percentages)
General and administrative ..... $1,997 $ — $1,997 $1,857 $— $1,857 7.5% 7.5%
Advertising and marketing ..... 935 — 935 1,002 — 1,002 (6.7)% (6.7)%
Litigation settlements ......... 2,483 (2,483) — 3 (3) — ** —
Depreciation and amortization . . 112 — 112 98 — 98 14.7% 14.7%
Total operating expenses ...... $5,526 $(2,483) $3,043 $2,959 $ (3) $2,956 86.7% 2.9%
Total operating expenses as a
percentage of net revenues . . . 110.7% 61.0% 72.8% 72.7%
* Note that figures in the above tables may not sum due to rounding.
** Not meaningful, see “—Litigation Settlements” for more information.
57