MasterCard 2009 Annual Report Download - page 71
Download and view the complete annual report
Please find page 71 of the 2009 MasterCard annual report below. You can navigate through the pages in the report by either clicking on the pages listed below, or by using the keyword search tool below to find specific information within the annual report.-
 1
1 -
2
-
3
-
4
-
5
-
6
-
7
-
8
-
9
-
10
-
11
-
12
-
13
-
14
-
15
-
16
-
17
-
18
-
19
-
20
-
21
-
22
-
23
-
24
-
25
-
26
-
27
-
28
-
29
-
30
-
31
-
32
-
33
-
34
-
35
-
36
-
37
-
38
-
39
-
40
-
41
-
42
-
43
-
44
-
45
-
46
-
47
-
48
-
49
-
50
-
51
-
52
-
53
-
54
-
55
-
56
-
57
-
58
-
59
-
60
-
 61
61 -
 62
62 -
 63
63 -
 64
64 -
 65
65 -
 66
66 -
 67
67 -
 68
68 -
 69
69 -
 70
70 -
 71
71 -
 72
72 -
 73
73 -
 74
74 -
 75
75 -
 76
76 -
 77
77 -
 78
78 -
 79
79 -
 80
80 -
 81
81 -
82
-
83
-
84
-
85
-
86
-
87
-
88
-
89
-
90
-
91
-
92
-
93
-
94
-
95
-
96
-
97
-
98
-
99
-
100
-
101
-
102
-
103
-
104
-
105
-
106
-
107
-
108
-
109
-
110
-
111
-
112
-
113
-
114
-
115
-
116
-
117
-
118
-
119
-
120
-
121
-
122
-
123
-
124
-
125
-
126
-
127
-
128
-
129
-
130
-
131
-
132
-
133
-
134
-
135
-
136
-
137
-
138
-
139
-
140
-
141
-
142
-
143
-
144
-
145
-
146
-
147
-
148
-
149
-
150
-
151
-
152
-
153
-
154
-
155
-
156
 |
 |

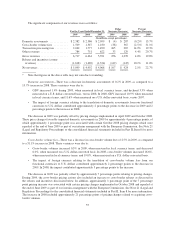
• Investment income decreased $125 million and $347 million in 2009 and 2008, respectively. The
decreases were primarily due to lower interest income as a result of lower interest rates than in the prior
years and realized gains from the sale of the Company’s RedeCard S.A. investment. The Company sold
22% and 78% of its shares of common stock in RedeCard S.A., and realized gains of $86 million and
$391 million, in 2008 and 2007, respectively.
• Interest expense increased $12 million and $46 million in 2009 and 2008, respectively. The increases
were primarily due to interest accretion associated with the American Express Settlement partially offset
by lower interest accretion on the U.S. Merchant Lawsuit Settlement in 2009 and 2008. Additionally, in
2008 there was higher interest expense on uncertain tax positions.
• Other income in 2009 included a gain of approximately $14 million on the prepayment of the
Company’s remaining obligation on the U.S. Merchant Lawsuit Settlement. A $75 million gain related
to the termination of a customer business agreement was recognized in 2008 and a $90 million
settlement gain with the organization that operates the World Cup soccer events was recognized in
2007. See Note 25 (Other Income) to the consolidated financial statements included in Part II, Item 8 for
additional discussion.
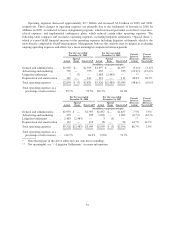
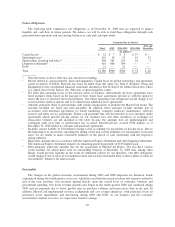
Income Taxes
The effective income tax rate for the years ended December 31, 2009, 2008 and 2007 was 34.1%, 33.7%
and 35.0%, respectively. The primary cause of the changes in the effective rates was due to the litigation
settlement charges recorded in 2008, which resulted in a pretax loss in a higher tax jurisdiction and pretax
income in lower tax jurisdictions. In addition, deferred tax assets were remeasured and reduced by $15 million
and $21 million in 2009 and 2008, respectively, due to changes in our state effective tax rate. As a result of the
remeasurements, our income tax expense was increased for the same amounts.
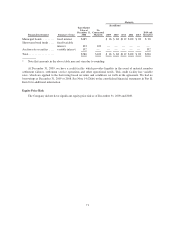
The components impacting the effective income tax rates as compared to the U.S. federal statutory tax rate
of 35.0% are as follows:
For the years ended December 31,
2009 2008 2007
Dollar
Amount Percent
Dollar
Amount Percent
Dollar
Amount Percent
(In millions, except percentages)
Income (loss) before income tax expense ............. $2,218 $(383) $1,671
Federal statutory tax .............................. $ 776 35.0% $(134) 35.0% $ 585 35.0%
State tax effect, net of federal benefit ................ 25 1.1 11 (2.9) 28 1.6
Foreign tax effect, net of federal benefit .............. (22) (1.0) 2 (0.5) (12) (0.7)
Non-deductible expenses and other differences ......... (18) (0.8) 2 (0.7) (3) (0.2)
Tax exempt income .............................. (6) (0.3) (10) 2.8 (12) (0.7)
Income tax expense (benefit) ....................... $ 755 34.1% $(129) 33.7% $ 586 35.0%
* Note that table may not sum due to rounding
61