Delta Airlines 2011 Annual Report Download - page 89
Download and view the complete annual report
Please find page 89 of the 2011 Delta Airlines annual report below. You can navigate through the pages in the report by either clicking on the pages listed below, or by using the keyword search tool below to find specific information within the annual report.-
 1
1 -
2
-
3
-
4
-
5
-
6
-
7
-
8
-
9
-
10
-
11
-
12
-
13
-
14
-
15
-
16
-
17
-
18
-
19
-
20
-
21
-
22
-
23
-
24
-
25
-
26
-
27
-
28
-
29
-
30
-
31
-
32
-
33
-
34
-
35
-
36
-
37
-
38
-
39
-
40
-
41
-
42
-
43
-
44
-
45
-
46
-
47
-
48
-
49
-
50
-
51
-
52
-
53
-
54
-
55
-
56
-
57
-
58
-
59
-
60
-
61
-
62
-
63
-
64
-
65
-
66
-
67
-
68
-
69
-
70
-
71
-
72
-
73
-
74
-
75
-
76
-
77
-
78
-
 79
79 -
 80
80 -
 81
81 -
 82
82 -
 83
83 -
 84
84 -
 85
85 -
 86
86 -
 87
87 -
 88
88 -
 89
89 -
 90
90 -
 91
91 -
 92
92 -
 93
93 -
 94
94 -
 95
95 -
 96
96 -
 97
97 -
 98
98 -
 99
99 -
100
-
101
-
102
-
103
-
104
-
105
-
106
-
107
-
108
-
109
-
110
-
111
-
112
-
113
-
114
-
115
-
116
-
117
-
118
-
119
-
120
-
121
-
122
-
123
-
124
-
125
-
126
-
127
-
128
-
129
-
130
-
131
-
132
-
133
-
134
-
135
-
136
-
137
-
138
-
139
-
140
-
141
-
142
-
143
-
144
 |
 |

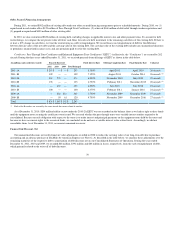
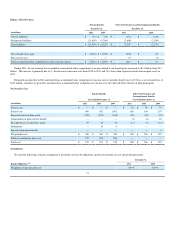
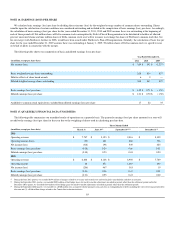
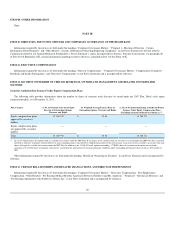
The following table presents the principal reasons for the difference between the effective tax rate and the U.S. federal statutory income tax rate:
Year Ended December 31,
2011 2010 2009
U.S. federal statutory income tax rate 35.0 % 35.0 % (35.0)%
State taxes 3.4 2.3 (1.8)
(Decrease) increase in valuation allowance (45.7) (42.3) 32.9
Release of uncertain tax position reserve (9.0) — —
Income Tax Allocation(1) — — (20.2)
Other, net 5.3 7.6 2.4
Effective income tax rate (11.0)% 2.6 % (21.7)%
(1) We consider all income sources, including other comprehensive income, in determining the amount of tax benefit allocated to continuing operations (the “Income Tax Allocation”). For the
year ended December 31, 2009, as a result of the Income Tax Allocation, we recorded a non-cash income tax benefit of $321 million on the loss from continuing operations, with an
offsetting non-cash income tax expense of $321 million in other comprehensive income.
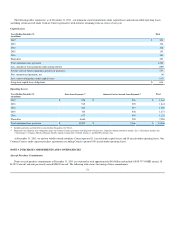
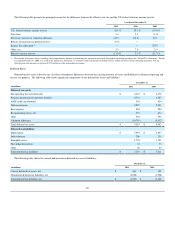
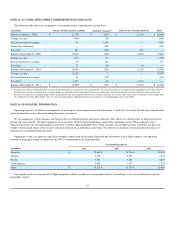
Deferred Taxes
Deferred income taxes reflect the net tax effect of temporary differences between the carrying amounts of assets and liabilities for financial reporting and
income tax purposes. The following table shows significant components of our deferred tax assets and liabilities:
December 31,
(in millions) 2011 2010
Deferred tax assets:
Net operating loss carryforwards $ 6,647 $ 6,472
Pension, postretirement and other benefits 5,703 4,527
AMT credit carryforward 402 424
Deferred revenue 2,297 2,202
Rent expense 284 280
Reorganization items, net 395 674
Other 564 495
Valuation allowance (10,705) (9,632)
Total deferred tax assets $ 5,587 $ 5,442
Deferred tax liabilities:
Depreciation $ 5,093 $ 4,837
Debt valuation 206 330
Intangible assets 1,755 1,731
Fuel hedge derivatives 32 73
Other 68 40
Total deferred tax liabilities $ 7,154 $ 7,011
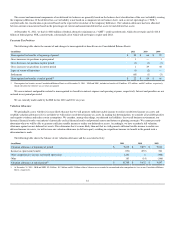
The following table shows the current and noncurrent deferred tax assets (liabilities):
December 31,
(in millions) 2011 2010
Current deferred tax assets, net $ 461 $ 355
Noncurrent deferred tax liabilities, net (2,028) (1,924)
Total deferred tax liabilities, net $ (1,567) $ (1,569)
80