Delta Airlines 2011 Annual Report Download - page 32
Download and view the complete annual report
Please find page 32 of the 2011 Delta Airlines annual report below. You can navigate through the pages in the report by either clicking on the pages listed below, or by using the keyword search tool below to find specific information within the annual report.-
 1
1 -
2
-
3
-
4
-
5
-
6
-
7
-
8
-
9
-
10
-
11
-
12
-
13
-
14
-
15
-
16
-
17
-
18
-
19
-
20
-
21
-
 22
22 -
 23
23 -
 24
24 -
 25
25 -
 26
26 -
 27
27 -
 28
28 -
 29
29 -
 30
30 -
 31
31 -
 32
32 -
 33
33 -
 34
34 -
 35
35 -
 36
36 -
 37
37 -
 38
38 -
 39
39 -
 40
40 -
 41
41 -
 42
42 -
43
-
44
-
45
-
46
-
47
-
48
-
49
-
50
-
51
-
52
-
53
-
54
-
55
-
56
-
57
-
58
-
59
-
60
-
61
-
62
-
63
-
64
-
65
-
66
-
67
-
68
-
69
-
70
-
71
-
72
-
73
-
74
-
75
-
76
-
77
-
78
-
79
-
80
-
81
-
82
-
83
-
84
-
85
-
86
-
87
-
88
-
89
-
90
-
91
-
92
-
93
-
94
-
95
-
96
-
97
-
98
-
99
-
100
-
101
-
102
-
103
-
104
-
105
-
106
-
107
-
108
-
109
-
110
-
111
-
112
-
113
-
114
-
115
-
116
-
117
-
118
-
119
-
120
-
121
-
122
-
123
-
124
-
125
-
126
-
127
-
128
-
129
-
130
-
131
-
132
-
133
-
134
-
135
-
136
-
137
-
138
-
139
-
140
-
141
-
142
-
143
-
144
 |
 |

ITEM 7. MANAGEMENT'S DISCUSSION AND ANALYSIS OF FINANCIAL CONDITION AND RESULTS OF OPERATIONS
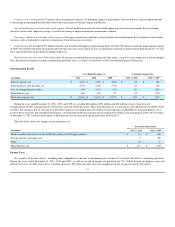
Financial Highlights - 2011 Compared to 2010
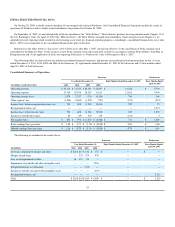
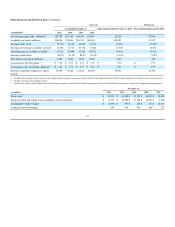
Our net income for 2011 was $854 million , or $1.01 per diluted share. This is $261 million higher than 2010 despite significantly higher fuel costs.
Total operating revenue increased $3.4 billion , on an 11% increase in passenger mile yield, primarily due to higher passenger revenues as we were able to
adjust ticket prices in response to higher fuel prices. Total operating expense was up $3.6 billion , or 12% , driven primarily by a $2.9 billion increase in fuel
expense (including our contract carriers under capacity purchase agreements).
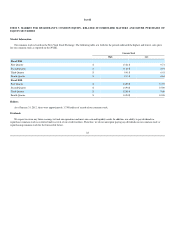
Fuel price volatility continues to represent a significant risk to our business and the airline industry as a whole. Our fuel cost per gallon increased 31%
from 2010 to 2011 . During 2011 , fuel expense, including amounts under contract carrier agreements, increased by $2.9 billion and now represents 36% of
total operating expense. During 2011 , gains from our hedging program reduced fuel expense by $420 million . Including fuel hedge activity, our average
price per fuel gallon in 2011 was $3.06 as compared to $2.33 in 2010 .
Our consolidated operating cost per available seat mile ("CASM") for 2011 increased to 14.12 cents compared to 12.69 cents in 2010 , primarily
reflecting higher fuel prices. For 2011 , CASM-Ex (a non-GAAP financial measure as defined in "Supplemental Information" below) was 8.53 cents, or 3%
higher than 2010 , primarily reflecting higher revenue-related expenses and salaries and related costs.
During 2011 , we reduced our total debt and capital leases by $1.5 billion and ended the year with $5.4 billion in unrestricted liquidity, consisting of cash
and cash equivalents, short-term investments and availability under credit facilities.
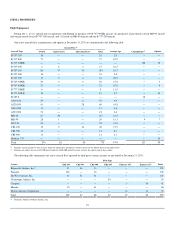
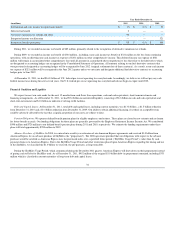
Fleet Strategy
During 2011, we entered into an agreement with The Boeing Company ("Boeing") to purchase 100 B-737-900ER aircraft with deliveries beginning in
2013 and continuing through 2018. We have obtained committed long-term financing for a substantial portion of the purchase price of these aircraft. The
Boeing agreement and our plans to bring into service 30 to 40 previously owned MD-90 aircraft over the next two to three years will enable us to replace on a
capacity-neutral basis older, less efficient aircraft scheduled to be retired. The majority of the MD-90 aircraft scheduled to come into service over the next two
to three years were purchased or leased in 2010 and 2011. These B-737-900ER and MD-90 aircraft will have lower unit costs than the aircraft they are
replacing as a result of lower maintenance costs and fuel efficiencies.
In addition to lowering unit costs, we are also investing in our fleet to enhance the customer experience. The state-of-the-art B-737-900ER will offer an
industry leading customer experience, including expanded carry-on baggage space and a roomier cabin. By the end of 2013, our entire widebody international
fleet will be updated with full flat-bed seats in BusinessElite. We completed the installation of full flat-bed seats in the BusinessElite cabin of our B-777 and
B-767-400ER aircraft during 2011. Due to the success of our Economy Comfort product, which we began offering during the 2011 summer on long-haul
international flights, we are expanding Economy Comfort throughout our mainline and regional fleet by the summer of 2012. We have also been investing in
our domestic and regional fleet, with in-flight WiFi on all two-class domestic aircraft, interior upgrades and the installation of additional First Class seating.
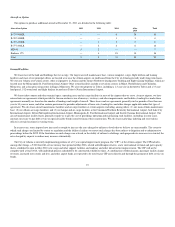
New York Strategy
Strengthening our position in New York City is an important part of our network strategy. As discussed below, key components of this strategy are
operating a domestic hub at New York's LaGuardia Airport ("LaGuardia") and creating a state-of-the-art facility at New York's John F. Kennedy International
Airport ("JFK").
LaGuardia. During December 2011, we closed the transactions contemplated under an agreement with US Airways including the exchange of takeoff and
landing rights (each a "slot pair") at LaGuardia and Reagan National airports, which will allow us to operate a new domestic hub at LaGuardia. Under the
agreement, (1) Delta acquired 132 slot pairs at LaGuardia from US Airways and (2) US Airways acquired from Delta 42 slot pairs at Reagan National; the
rights to operate additional daily service to São Paulo, Brazil in 2015; and $66.5 million in cash. Additionally, Delta divested 16 slot pairs at LaGuardia and
eight slot pairs at Reagan National to airlines with limited or no service at those airports.
26