Delta Airlines 2011 Annual Report Download - page 80
Download and view the complete annual report
Please find page 80 of the 2011 Delta Airlines annual report below. You can navigate through the pages in the report by either clicking on the pages listed below, or by using the keyword search tool below to find specific information within the annual report.-
 1
1 -
2
-
3
-
4
-
5
-
6
-
7
-
8
-
9
-
10
-
11
-
12
-
13
-
14
-
15
-
16
-
17
-
18
-
19
-
20
-
21
-
22
-
23
-
24
-
25
-
26
-
27
-
28
-
29
-
30
-
31
-
32
-
33
-
34
-
35
-
36
-
37
-
38
-
39
-
40
-
41
-
42
-
43
-
44
-
45
-
46
-
47
-
48
-
49
-
50
-
51
-
52
-
53
-
54
-
55
-
56
-
57
-
58
-
59
-
60
-
61
-
62
-
63
-
64
-
65
-
66
-
67
-
68
-
69
-
 70
70 -
 71
71 -
 72
72 -
 73
73 -
 74
74 -
 75
75 -
 76
76 -
 77
77 -
 78
78 -
 79
79 -
 80
80 -
 81
81 -
 82
82 -
 83
83 -
 84
84 -
 85
85 -
 86
86 -
 87
87 -
 88
88 -
 89
89 -
 90
90 -
91
-
92
-
93
-
94
-
95
-
96
-
97
-
98
-
99
-
100
-
101
-
102
-
103
-
104
-
105
-
106
-
107
-
108
-
109
-
110
-
111
-
112
-
113
-
114
-
115
-
116
-
117
-
118
-
119
-
120
-
121
-
122
-
123
-
124
-
125
-
126
-
127
-
128
-
129
-
130
-
131
-
132
-
133
-
134
-
135
-
136
-
137
-
138
-
139
-
140
-
141
-
142
-
143
-
144
 |
 |

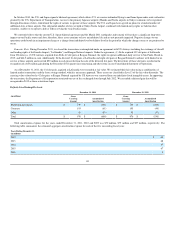
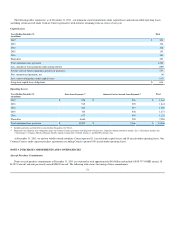
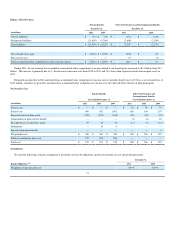
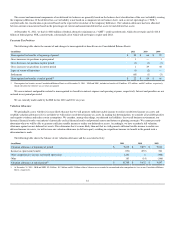
Future Maturities
The following table summarizes scheduled maturities of our debt, including current maturities, at December 31, 2011:
Years Ending December 31,
(in millions) Total Secured and Unsecured Debt Amortization of Debt Discount, net
2012 $ 1,925 $ (199)
2013 1,558 (157)
2014 2,286 (104)
2015 1,347 (75)
2016 1,240 (66)
Thereafter 5,441 (136)
Total $ 13,797 $ (737) $ 13,060
Fair Value of Debt
Market risk associated with our fixed and variable rate long-term debt relates to the potential reduction in fair value and negative impact to future
earnings, respectively, from an increase in interest rates. In the table below, the aggregate fair value of debt was based primarily on reported market values,
recently completed market transactions and estimates based on interest rates, maturities, credit risk and underlying collateral:
December 31,
(in millions) 2011 2010
Total debt at par value $ 13,797 $ 15,442
Unamortized discount, net (737) (935)
Net carrying amount $ 13,060 $ 14,507
Fair value $ 13,600 $ 15,400
NOTE 8. LEASE OBLIGATIONS
We lease aircraft, airport terminals, maintenance facilities, ticket offices and other property and equipment from third parties. Rental expense for operating
leases, which is recorded on a straight-line basis over the life of the lease term, totaled $1.1 billion, $1.2 billion and $1.3 billion for the years ended
December 31, 2011, 2010 and 2009, respectively. Amounts due under capital leases are recorded as liabilities, while assets acquired under capital leases are
recorded as property and equipment. Amortization of assets recorded under capital leases is included in depreciation and amortization expense. Many of our
aircraft, facility, and equipment leases include rental escalation clauses and/or renewal options. Our leases do not include residual value guarantees and we are
not the primary beneficiary in or have other forms of variable interest with the lessor of the leased assets. As a result, we have not consolidated any of the
entities that lease to us.
71