Delta Airlines 2011 Annual Report Download - page 55
Download and view the complete annual report
Please find page 55 of the 2011 Delta Airlines annual report below. You can navigate through the pages in the report by either clicking on the pages listed below, or by using the keyword search tool below to find specific information within the annual report.-
 1
1 -
2
-
3
-
4
-
5
-
6
-
7
-
8
-
9
-
10
-
11
-
12
-
13
-
14
-
15
-
16
-
17
-
18
-
19
-
20
-
21
-
22
-
23
-
24
-
25
-
26
-
27
-
28
-
29
-
30
-
31
-
32
-
33
-
34
-
35
-
36
-
37
-
38
-
39
-
40
-
41
-
42
-
43
-
44
-
 45
45 -
 46
46 -
 47
47 -
 48
48 -
 49
49 -
 50
50 -
 51
51 -
 52
52 -
 53
53 -
 54
54 -
 55
55 -
 56
56 -
 57
57 -
 58
58 -
 59
59 -
 60
60 -
 61
61 -
 62
62 -
 63
63 -
 64
64 -
 65
65 -
66
-
67
-
68
-
69
-
70
-
71
-
72
-
73
-
74
-
75
-
76
-
77
-
78
-
79
-
80
-
81
-
82
-
83
-
84
-
85
-
86
-
87
-
88
-
89
-
90
-
91
-
92
-
93
-
94
-
95
-
96
-
97
-
98
-
99
-
100
-
101
-
102
-
103
-
104
-
105
-
106
-
107
-
108
-
109
-
110
-
111
-
112
-
113
-
114
-
115
-
116
-
117
-
118
-
119
-
120
-
121
-
122
-
123
-
124
-
125
-
126
-
127
-
128
-
129
-
130
-
131
-
132
-
133
-
134
-
135
-
136
-
137
-
138
-
139
-
140
-
141
-
142
-
143
-
144
 |
 |

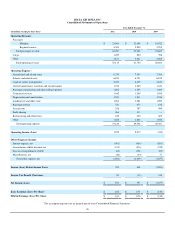
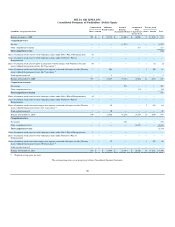
DELTA AIR LINES, INC.
Consolidated Statements of Operations
Year Ended December 31,
(in millions, except per share data) 2011 2010 2009
Operating Revenue:
Passenger:
Mainline $ 23,864 $ 21,408 $ 18,522
Regional carriers 6,393 5,850 5,285
Total passenger revenue 30,257 27,258 23,807
Cargo 1,027 850 788
Other 3,831 3,647 3,468
Total operating revenue 35,115 31,755 28,063
Operating Expense:
Aircraft fuel and related taxes 9,730 7,594 7,384
Salaries and related costs 6,894 6,751 6,838
Contract carrier arrangements 5,470 4,305 3,823
Aircraft maintenance materials and outside repairs 1,765 1,569 1,434
Passenger commissions and other selling expenses 1,682 1,509 1,405
Contracted services 1,642 1,549 1,595
Depreciation and amortization 1,523 1,511 1,536
Landing fees and other rents 1,281 1,281 1,289
Passenger service 721 673 638
Aircraft rent 298 387 480
Profit sharing 264 313 —
Restructuring and other items 242 450 407
Other 1,628 1,646 1,558
Total operating expense 33,140 29,538 28,387
Operating Income (Loss) 1,975 2,217 (324)
Other (Expense) Income:
Interest expense, net (901) (969) (881)
Amortization of debt discount, net (193) (216) (370)
Loss on extinguishment of debt (68) (391) (83)
Miscellaneous, net (44) (33) 77
Total other expense, net (1,206) (1,609) (1,257)
Income (Loss) Before Income Taxes 769 608 (1,581)
Income Tax Benefit (Provision) 85 (15) 344
Net Income (Loss) $ 854 $ 593 $ (1,237)
Basic Earnings (Loss) Per Share $ 1.02 $ 0.71 $ (1.50)
Diluted Earnings (Loss) Per Share $ 1.01 $ 0.70 $ (1.50)
The accompanying notes are an integral part of these Consolidated Financial Statements.
48