Delta Airlines 2011 Annual Report Download - page 42
Download and view the complete annual report
Please find page 42 of the 2011 Delta Airlines annual report below. You can navigate through the pages in the report by either clicking on the pages listed below, or by using the keyword search tool below to find specific information within the annual report.-
 1
1 -
2
-
3
-
4
-
5
-
6
-
7
-
8
-
9
-
10
-
11
-
12
-
13
-
14
-
15
-
16
-
17
-
18
-
19
-
20
-
21
-
22
-
23
-
24
-
25
-
26
-
27
-
28
-
29
-
30
-
31
-
 32
32 -
 33
33 -
 34
34 -
 35
35 -
 36
36 -
 37
37 -
 38
38 -
 39
39 -
 40
40 -
 41
41 -
 42
42 -
 43
43 -
 44
44 -
 45
45 -
 46
46 -
 47
47 -
 48
48 -
 49
49 -
 50
50 -
 51
51 -
 52
52 -
53
-
54
-
55
-
56
-
57
-
58
-
59
-
60
-
61
-
62
-
63
-
64
-
65
-
66
-
67
-
68
-
69
-
70
-
71
-
72
-
73
-
74
-
75
-
76
-
77
-
78
-
79
-
80
-
81
-
82
-
83
-
84
-
85
-
86
-
87
-
88
-
89
-
90
-
91
-
92
-
93
-
94
-
95
-
96
-
97
-
98
-
99
-
100
-
101
-
102
-
103
-
104
-
105
-
106
-
107
-
108
-
109
-
110
-
111
-
112
-
113
-
114
-
115
-
116
-
117
-
118
-
119
-
120
-
121
-
122
-
123
-
124
-
125
-
126
-
127
-
128
-
129
-
130
-
131
-
132
-
133
-
134
-
135
-
136
-
137
-
138
-
139
-
140
-
141
-
142
-
143
-
144
 |
 |
Cash used in investing activities totaled $2.0 billion for 2010, primarily reflecting investments of (1) $1.1 billion for flight equipment, including aircraft
modifications and parts, (2) $287 million for ground property and equipment and (3) $815 million for purchases of investments. Flight equipment acquisitions
include the purchase of 34 aircraft, four of which were purchased new from the manufacturer, 18 of which were previously leased and 12 of which were
previously owned.
Cash used in investing activities totaled $1.0 billion for 2009, primarily reflecting net investments of $951 million for flight equipment and $251 million
for ground property and equipment. Cash used in investing activities was partially offset by a distribution of our investment in a money market fund that was
liquidated in an orderly manner in 2010 and proceeds from the sale of flight equipment.
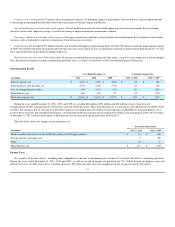
Cash Flows From Financing Activities
Cash used in financing activities totaled $1.6 billion for 2011, reflecting the repayment of $2.8 billion in long-term debt and capital lease obligations,
partially offset by $1.0 billion in proceeds from aircraft and other aircraft-related financing and $318 million from the use of our fuel card. We also refinanced
our $2.5 billion senior secured exit financing facilities as discussed above.
Cash used in financing activities totaled $2.5 billion for 2010, reflecting the repayment of $3.7 billion in long-term debt and capital lease obligations,
including the repayment of $914 million of our Exit Revolving Facility. Cash used in financing activities was partially offset by $1.1 billion in proceeds from
EETC aircraft financing.
Cash used in financing activities totaled $19 million for 2009, primarily reflecting $3.0 billion in proceeds from long-term debt and aircraft financing,
largely associated with the issuance of (1) $2.1 billion under three new financings, which included (a) $750 million of senior secured credit facilities, (b) $750
million of senior secured notes, and (c) $600 million of senior second lien notes, (2) $342 million from the 2009-1 EETC offering and (3) $150 million of tax
exempt bonds, mostly offset by the repayment of $2.9 billion in long-term debt and capital lease obligations, including the Northwest senior secured exit
financing facility and a $500 million revolving facility.
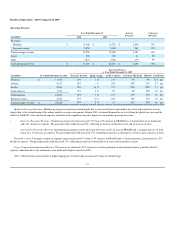
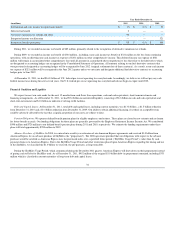
Contractual Obligations
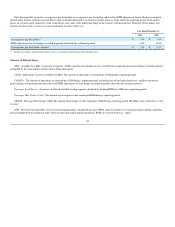
The following table summarizes our contractual obligations at December 31, 2011 that we expect will be paid in cash. The table does not include amounts
that are contingent on events or other factors that are uncertain or unknown at this time, including legal contingencies, uncertain tax positions, and amounts
payable under collective bargaining arrangements, among others. In addition, the table does not include expected significant cash payments which are
generally ordinary course of business obligations that do not include contractual commitments.
The amounts presented are based on various estimates, including estimates regarding the timing of payments, prevailing interest rates, volumes purchased,
the occurrence of certain events and other factors. Accordingly, the actual results may vary materially from the amounts presented in the table.
During 2011, our contractual obligations were impacted by our agreement with Boeing to purchase 100 B-737-900ER aircraft with deliveries beginning in
2013 and continuing through 2018. Our estimated payments to purchase these aircraft are included in aircraft purchase obligations below.
Contractual Obligations by Year (1)
(in millions) 2012 2013 2014 2015 2016 Thereafter Total
Long-term debt (see Note 7)
Principal amount $ 1,592 $ 1,225 $ 2,000 $ 1,347 $ 1,240 $ 5,441 $ 12,845
Interest payments 710 630 560 410 320 800 3,430
Contract carrier obligations (see Note 9) 2,340 2,420 2,430 2,400 2,100 5,700 17,390
Operating lease payments (see Note 8) 1,462 1,441 1,380 1,271 1,126 7,588 14,268
Employee benefit obligations (see Note 10) 830 790 800 810 780 10,920 14,930
Aircraft purchase commitments (see Note 9) 215 530 745 760 760 3,810 6,820
Capital lease obligations (see Note 8) 221 196 168 155 163 323 1,226
Other obligations 510 230 210 120 70 170 1,310
Total $ 7,880 $ 7,462 $ 8,293 $ 7,273 $ 6,559 $ 34,752 $ 72,219
(1) For additional information, see the Notes to the Consolidated Financial Statements referenced in the table above.
36