Delta Airlines 2011 Annual Report Download - page 38
Download and view the complete annual report
Please find page 38 of the 2011 Delta Airlines annual report below. You can navigate through the pages in the report by either clicking on the pages listed below, or by using the keyword search tool below to find specific information within the annual report.-
 1
1 -
2
-
3
-
4
-
5
-
6
-
7
-
8
-
9
-
10
-
11
-
12
-
13
-
14
-
15
-
16
-
17
-
18
-
19
-
20
-
21
-
22
-
23
-
24
-
25
-
26
-
27
-
 28
28 -
 29
29 -
 30
30 -
 31
31 -
 32
32 -
 33
33 -
 34
34 -
 35
35 -
 36
36 -
 37
37 -
 38
38 -
 39
39 -
 40
40 -
 41
41 -
 42
42 -
 43
43 -
 44
44 -
 45
45 -
 46
46 -
 47
47 -
 48
48 -
49
-
50
-
51
-
52
-
53
-
54
-
55
-
56
-
57
-
58
-
59
-
60
-
61
-
62
-
63
-
64
-
65
-
66
-
67
-
68
-
69
-
70
-
71
-
72
-
73
-
74
-
75
-
76
-
77
-
78
-
79
-
80
-
81
-
82
-
83
-
84
-
85
-
86
-
87
-
88
-
89
-
90
-
91
-
92
-
93
-
94
-
95
-
96
-
97
-
98
-
99
-
100
-
101
-
102
-
103
-
104
-
105
-
106
-
107
-
108
-
109
-
110
-
111
-
112
-
113
-
114
-
115
-
116
-
117
-
118
-
119
-
120
-
121
-
122
-
123
-
124
-
125
-
126
-
127
-
128
-
129
-
130
-
131
-
132
-
133
-
134
-
135
-
136
-
137
-
138
-
139
-
140
-
141
-
142
-
143
-
144
 |
 |

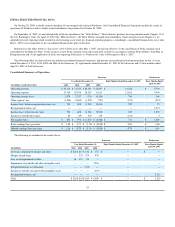
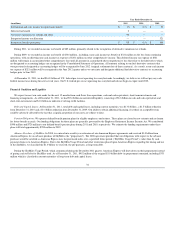
Operating Expense
Year Ended December 31, Increase
(Decrease) % Increase
(Decrease)
(in millions) 2010 2009
Aircraft fuel and related taxes $ 7,594 $ 7,384 $ 210 3 %
Salaries and related costs 6,751 6,838 (87) (1)%
Contract carrier arrangements 4,305 3,823 482 13 %
Aircraft maintenance materials and outside repairs 1,569 1,434 135 9 %
Passenger commissions and other selling expenses 1,509 1,405 104 7 %
Contracted services 1,549 1,595 (46) (3)%
Depreciation and amortization 1,511 1,536 (25) (2)%
Landing fees and other rents 1,281 1,289 (8) (1)%
Passenger service 673 638 35 5 %
Aircraft rent 387 480 (93) (19)%
Profit sharing 313 — 313 NM(1)
Restructuring and other items 450 407 43 11 %
Other 1,646 1,558 88 6 %
Total operating expense $ 29,538 $ 28,387 $ 1,151 4 %
(1) NM - not meaningful
On July 1, 2010, we sold Compass and Mesaba, our wholly-owned subsidiaries, to Trans States and Pinnacle, respectively. Upon the closing of these
transactions, we entered into new or amended long-term capacity purchase agreements with Compass, Mesaba and Pinnacle. Prior to these sales, expenses
related to Compass and Mesaba as our wholly-owned subsidiaries were reported in the applicable expense line items. Subsequent to these sales, expenses
related to Compass and Mesaba are reported as contract carrier arrangements expense.
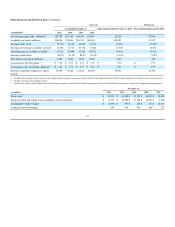
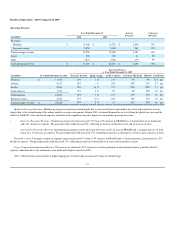
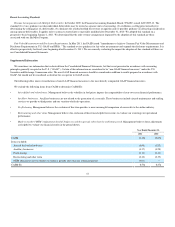
Fuel Expense. Including contract carriers under capacity purchase agreements, fuel expense increased $610 million on flat consumption. The table below
presents fuel expense, gallons consumed, and our average price per fuel gallon, including the impact of fuel hedge activity:
Year Ended December 31, Increase
(Decrease) % Increase
(Decrease)
(in millions, except per gallon data) 2010 2009
Aircraft fuel and related taxes $ 7,594 $ 7,384 $ 210
Aircraft fuel and related taxes included within contract carrier arrangements 1,307 907 400
Total fuel expense $ 8,901 $ 8,291 $ 610 7 %
Total fuel consumption (gallons) 3,823 3,853 (30) (1)%
Average price per fuel gallon $ 2.33 $ 2.15 $ 0.18 8 %
Fuel expense increased primarily due to higher unhedged fuel prices, partially offset by an improvement in net fuel hedge results. Fuel hedge losses in
2009 were primarily due to hedge contracts purchased in 2008 when fuel prices reached record highs and were expected to continue to rise, but instead
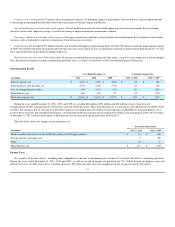
declined. The table below shows the impact of hedging on fuel expense and average price per fuel gallon:
Average Price Per Gallon
Year Ended December 31, Increase
(Decrease) Year Ended December 31, Increase
(Decrease)
(in millions, except per gallon data) 2010 2009 2010 2009
Fuel purchase cost $ 8,812 $ 6,932 $ 1,880 $ 2.31 $ 1.80 $ 0.51
Fuel hedge (gains) losses 89 1,359 (1,270) 0.02 0.35 (0.33)
Total fuel expense $ 8,901 $ 8,291 $ 610 $ 2.33 $ 2.15 $ 0.18
32