Delta Airlines 2011 Annual Report Download - page 36
Download and view the complete annual report
Please find page 36 of the 2011 Delta Airlines annual report below. You can navigate through the pages in the report by either clicking on the pages listed below, or by using the keyword search tool below to find specific information within the annual report.-
 1
1 -
2
-
3
-
4
-
5
-
6
-
7
-
8
-
9
-
10
-
11
-
12
-
13
-
14
-
15
-
16
-
17
-
18
-
19
-
20
-
21
-
22
-
23
-
24
-
25
-
 26
26 -
 27
27 -
 28
28 -
 29
29 -
 30
30 -
 31
31 -
 32
32 -
 33
33 -
 34
34 -
 35
35 -
 36
36 -
 37
37 -
 38
38 -
 39
39 -
 40
40 -
 41
41 -
 42
42 -
 43
43 -
 44
44 -
 45
45 -
 46
46 -
47
-
48
-
49
-
50
-
51
-
52
-
53
-
54
-
55
-
56
-
57
-
58
-
59
-
60
-
61
-
62
-
63
-
64
-
65
-
66
-
67
-
68
-
69
-
70
-
71
-
72
-
73
-
74
-
75
-
76
-
77
-
78
-
79
-
80
-
81
-
82
-
83
-
84
-
85
-
86
-
87
-
88
-
89
-
90
-
91
-
92
-
93
-
94
-
95
-
96
-
97
-
98
-
99
-
100
-
101
-
102
-
103
-
104
-
105
-
106
-
107
-
108
-
109
-
110
-
111
-
112
-
113
-
114
-
115
-
116
-
117
-
118
-
119
-
120
-
121
-
122
-
123
-
124
-
125
-
126
-
127
-
128
-
129
-
130
-
131
-
132
-
133
-
134
-
135
-
136
-
137
-
138
-
139
-
140
-
141
-
142
-
143
-
144
 |
 |

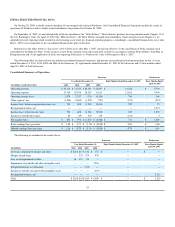
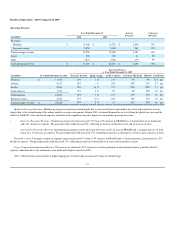
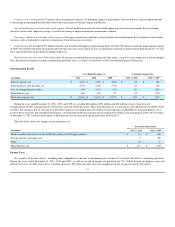
Our average price per fuel gallon, adjusted for mark-to-market adjustments for fuel hedges recorded in periods other than the settlement period (a non-
GAAP financial measure as defined in "Supplemental Information" below) was $3.05 for the year ended December 31, 2011. During 2011, our net fuel hedge
gains of $420 million included $26 million in gains for mark-to-market adjustments recorded in periods other than the settlement period. These mark-to-
market adjustments are based on market prices as of the end of the reporting period. Such market prices are not necessarily indicative of the actual future cash
value of the underlying hedge in the contract settlement period. Therefore, Delta adjusts fuel expense for these items to arrive at a more meaningful measure
of fuel cost.
Salaries and related costs. Salaries and related costs increased due to a 3% average increase in headcount and employee pay increases, partially offset by
the change in reporting described above due to the transactions involving Compass and Mesaba.
Contract carrier arrangements . Contract carrier arrangements expense, excluding the impact of fuel expense (discussed above), increased primarily due
to the change in reporting for the transactions involving Compass and Mesaba.
Aircraft maintenance materials and outside repairs. Aircraft maintenance materials and outside repairs expense increased primarily due to costs
associated with increased maintenance sales to third parties by our MRO services business, reflected in other revenue above.
Passenger commissions and other selling expenses. Credit card and sales commissions increased in conjunction with the 11% increase in passenger
revenue.
Aircraft rent. Aircraft rent decreased primarily due to the restructuring of certain existing leases and the change in reporting described above due to the
transactions involving Compass and Mesaba.
Restructuring and other items. Due to the nature of amounts recorded within restructuring and other items, a year over year comparison is not meaningful.
For a discussion of charges recorded in restructuring and other items, see Note 15 to the Notes of the Consolidated Financial Statements.
30