Delta Airlines 2011 Annual Report Download - page 48
Download and view the complete annual report
Please find page 48 of the 2011 Delta Airlines annual report below. You can navigate through the pages in the report by either clicking on the pages listed below, or by using the keyword search tool below to find specific information within the annual report.-
 1
1 -
2
-
3
-
4
-
5
-
6
-
7
-
8
-
9
-
10
-
11
-
12
-
13
-
14
-
15
-
16
-
17
-
18
-
19
-
20
-
21
-
22
-
23
-
24
-
25
-
26
-
27
-
28
-
29
-
30
-
31
-
32
-
33
-
34
-
35
-
36
-
37
-
 38
38 -
 39
39 -
 40
40 -
 41
41 -
 42
42 -
 43
43 -
 44
44 -
 45
45 -
 46
46 -
 47
47 -
 48
48 -
 49
49 -
 50
50 -
 51
51 -
 52
52 -
 53
53 -
 54
54 -
 55
55 -
 56
56 -
 57
57 -
 58
58 -
59
-
60
-
61
-
62
-
63
-
64
-
65
-
66
-
67
-
68
-
69
-
70
-
71
-
72
-
73
-
74
-
75
-
76
-
77
-
78
-
79
-
80
-
81
-
82
-
83
-
84
-
85
-
86
-
87
-
88
-
89
-
90
-
91
-
92
-
93
-
94
-
95
-
96
-
97
-
98
-
99
-
100
-
101
-
102
-
103
-
104
-
105
-
106
-
107
-
108
-
109
-
110
-
111
-
112
-
113
-
114
-
115
-
116
-
117
-
118
-
119
-
120
-
121
-
122
-
123
-
124
-
125
-
126
-
127
-
128
-
129
-
130
-
131
-
132
-
133
-
134
-
135
-
136
-
137
-
138
-
139
-
140
-
141
-
142
-
143
-
144
 |
 |

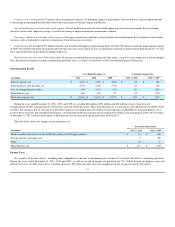
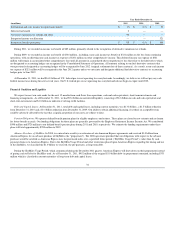
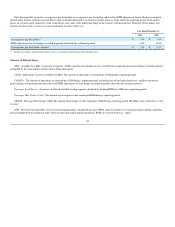
The following table reconciles average price per fuel gallon to average price per fuel gallon, adjusted for MTM adjustments for fuel hedges recorded in
periods other than the settlement period. These mark-to-market adjustments are based on market prices as of the end of the reporting period. Such market
prices are not necessarily indicative of the actual future cash value of the underlying hedge in the contract settlement period. Therefore, Delta adjusts fuel
expense for these items to arrive at a more meaningful measure of fuel cost.
Year Ended December 31,
2011 2008
Average price per fuel gallon(1) $ 3.06 $ 3.16
MTM adjustments for fuel hedges recorded in periods other than the settlement period (0.01) (0.03)
Average price per fuel gallon, adjusted $ 3.05 $ 3.13
(1) Includes fuel expense incurred under contract carriers arrangements and the impact of fuel hedge activity
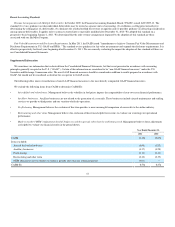
Glossary of Defined Terms
ASM - Available Seat Mile. A measure of capacity. ASMs equal the total number of seats available for transporting passengers during a reporting period
multiplied by the total number of miles flown during that period.
CASM - (Operating) Cost per Available Seat Mile. The amount of operating cost incurred per ASM during a reporting period.
CASM-Ex - The amount of operating cost incurred per ASM during a reporting period, excluding aircraft fuel and related taxes, ancillary businesses,
profit sharing, restructuring and other items and MTM adjustments for fuel hedges recorded in periods other than the settlement period.
Passenger Load Factor - A measure of utilized available seating capacity calculated by dividing RPMs by ASMs for a reporting period.
Passenger Mile Yield or Yield - The amount of passenger revenue earned per RPM during a reporting period.
PRASM - Passenger Revenue per ASM. The amount of passenger revenue earned per ASM during a reporting period. PRASM is also referred to as “unit
revenue.”
RPM - Revenue Passenger Mile. One revenue-paying passenger transported one mile. RPMs equal the number of revenue passengers during a reporting
period multiplied by the number of miles flown by those passengers during that period. RPMs are also referred to as “traffic.”
42