Delta Airlines 2011 Annual Report Download - page 63
Download and view the complete annual report
Please find page 63 of the 2011 Delta Airlines annual report below. You can navigate through the pages in the report by either clicking on the pages listed below, or by using the keyword search tool below to find specific information within the annual report.-
 1
1 -
2
-
3
-
4
-
5
-
6
-
7
-
8
-
9
-
10
-
11
-
12
-
13
-
14
-
15
-
16
-
17
-
18
-
19
-
20
-
21
-
22
-
23
-
24
-
25
-
26
-
27
-
28
-
29
-
30
-
31
-
32
-
33
-
34
-
35
-
36
-
37
-
38
-
39
-
40
-
41
-
42
-
43
-
44
-
45
-
46
-
47
-
48
-
49
-
50
-
51
-
52
-
 53
53 -
 54
54 -
 55
55 -
 56
56 -
 57
57 -
 58
58 -
 59
59 -
 60
60 -
 61
61 -
 62
62 -
 63
63 -
 64
64 -
 65
65 -
 66
66 -
 67
67 -
 68
68 -
 69
69 -
 70
70 -
 71
71 -
 72
72 -
 73
73 -
74
-
75
-
76
-
77
-
78
-
79
-
80
-
81
-
82
-
83
-
84
-
85
-
86
-
87
-
88
-
89
-
90
-
91
-
92
-
93
-
94
-
95
-
96
-
97
-
98
-
99
-
100
-
101
-
102
-
103
-
104
-
105
-
106
-
107
-
108
-
109
-
110
-
111
-
112
-
113
-
114
-
115
-
116
-
117
-
118
-
119
-
120
-
121
-
122
-
123
-
124
-
125
-
126
-
127
-
128
-
129
-
130
-
131
-
132
-
133
-
134
-
135
-
136
-
137
-
138
-
139
-
140
-
141
-
142
-
143
-
144
 |
 |

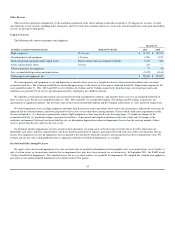
Other Revenue
Other revenue is primarily comprised of (1) the marketing component of the sale of mileage credits discussed above, (2) baggage fee revenue, (3) other
miscellaneous service revenue, including ticket change fees and (4) revenue from ancillary businesses, such as the aircraft maintenance and repair and staffing
services we provide to third parties.
Long-Lived Assets
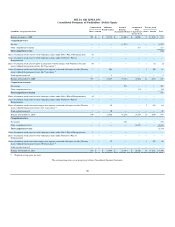
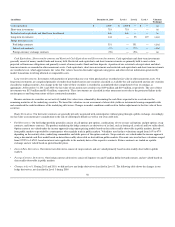
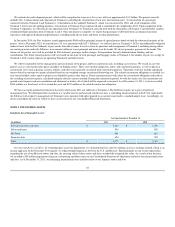
The following table shows our property and equipment:
December 31,
(in millions, except for estimated useful life) Estimated Useful Life 2011 2010
Flight equipment 21-30 years $ 21,001 $ 20,312
Ground property and equipment 3-40 years 3,256 3,123
Flight and ground equipment under capital leases Shorter of lease term or estimated useful life 1,127 988
Assets constructed for others 30 years 234 —
Advance payments for equipment 77 48
Less: accumulated depreciation and amortization (5,472) (4,164)
Total property and equipment, net $ 20,223 $ 20,307
We record property and equipment at cost and depreciate or amortize these assets on a straight-line basis to their estimated residual values over their
estimated useful lives. The estimated useful life for leasehold improvements is the shorter of lease term or estimated useful life. Depreciation expense for the
years ended December 31, 2011, 2010 and 2009 was $1.4 billion, $1.4 billion and $1.3 billion, respectively. Residual values for owned spare parts and
simulators are generally 5% of cost except when guaranteed by a third party for a different amount.
We capitalize certain internal and external costs incurred to develop and implement software, and amortize those costs over an estimated useful life of
three to seven years. For the years ended December 31, 2011, 2010 and 2009, we recorded $64 million, $71 million and $95 million, respectively, for
amortization of capitalized software. The net book value of these assets totaled $200 million and $153 million at December 31, 2011 and 2010, respectively.
We record impairment losses on flight equipment and other long-lived assets used in operations when events and circumstances indicate the assets may be
impaired and the estimated future cash flows generated by those assets are less than their carrying amounts. Factors which could cause impairment include,
but are not limited to, (1) a decision to permanently remove flight equipment or other long-lived assets from operations, (2) significant changes in the
estimated useful life, (3) significant changes in projected cash flows, (4) permanent and significant declines in fleet fair values and (5) changes to the
regulatory environment. For long-lived assets held for sale, we discontinue depreciation and record impairment losses when the carrying amount of these
assets is greater than the fair value less the cost to sell.
To determine whether impairments exist for aircraft used in operations, we group assets at the fleet-type level (the lowest level for which there are
identifiable cash flows) and then estimate future cash flows based on projections of capacity, passenger mile yield, fuel costs, labor costs and other relevant
factors. If an impairment occurs, the impairment loss recognized is the amount by which the aircraft's carrying amount exceeds its estimated fair value. We
estimate aircraft fair values using published sources, appraisals and bids received from third parties, as available.
Goodwill and Other Intangible Assets
We apply a fair value-based impairment test to the net book value of goodwill and indefinite-lived intangible assets on an annual basis (as of October 1)
and, if certain events or circumstances indicate that an impairment loss may have been incurred, on an interim basis. In September 2011, the FASB issued
"Testing Goodwill for Impairment." The standard revises the way in which entities test goodwill for impairment. We adopted this standard and applied its
provisions to our annual goodwill impairment test in the December 2011 quarter.
55