Delta Airlines 2011 Annual Report Download - page 86
Download and view the complete annual report
Please find page 86 of the 2011 Delta Airlines annual report below. You can navigate through the pages in the report by either clicking on the pages listed below, or by using the keyword search tool below to find specific information within the annual report.-
 1
1 -
2
-
3
-
4
-
5
-
6
-
7
-
8
-
9
-
10
-
11
-
12
-
13
-
14
-
15
-
16
-
17
-
18
-
19
-
20
-
21
-
22
-
23
-
24
-
25
-
26
-
27
-
28
-
29
-
30
-
31
-
32
-
33
-
34
-
35
-
36
-
37
-
38
-
39
-
40
-
41
-
42
-
43
-
44
-
45
-
46
-
47
-
48
-
49
-
50
-
51
-
52
-
53
-
54
-
55
-
56
-
57
-
58
-
59
-
60
-
61
-
62
-
63
-
64
-
65
-
66
-
67
-
68
-
69
-
70
-
71
-
72
-
73
-
74
-
75
-
 76
76 -
 77
77 -
 78
78 -
 79
79 -
 80
80 -
 81
81 -
 82
82 -
 83
83 -
 84
84 -
 85
85 -
 86
86 -
 87
87 -
 88
88 -
 89
89 -
 90
90 -
 91
91 -
 92
92 -
 93
93 -
 94
94 -
 95
95 -
 96
96 -
97
-
98
-
99
-
100
-
101
-
102
-
103
-
104
-
105
-
106
-
107
-
108
-
109
-
110
-
111
-
112
-
113
-
114
-
115
-
116
-
117
-
118
-
119
-
120
-
121
-
122
-
123
-
124
-
125
-
126
-
127
-
128
-
129
-
130
-
131
-
132
-
133
-
134
-
135
-
136
-
137
-
138
-
139
-
140
-
141
-
142
-
143
-
144
 |
 |

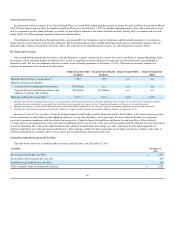
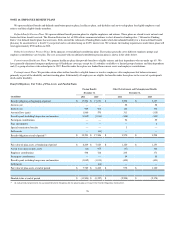
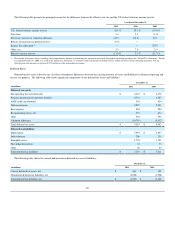
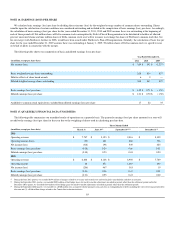
Balance Sheet Position
Pension Benefits Other Postretirement and Postemployment Benefits
December 31, December 31,
(in millions) 2011 2010 2011 2010
Current liabilities $ (16) $ (13) $ (137) $ (144)
Noncurrent liabilities (11,488) (9,244) (2,460) (2,034)
Total liabilities $ (11,504) $ (9,257) $ (2,597) $ (2,178)
Net actuarial (loss) gain $ (5,844) $ (3,299) $ (406) $ 44
Prior service cost — — (5) (3)
Total accumulated other comprehensive (loss) income, pretax $ (5,844) $ (3,299) $ (411) $ 41
During 2011, the net actuarial loss recorded in accumulated other comprehensive income related to our benefit plans increased to $6.3 billion from $3.3
billion . This increase is primarily due to (1) the decrease in discount rates from 2010 to 2011 and (2) a lower than expected actual return on plan assets in
2011.
Estimated amounts that will be amortized from accumulated other comprehensive income into net periodic benefit cost in 2012 are a net actuarial loss of
$163 million. Amounts are generally amortized into accumulated other comprehensive income over the expected future lifetime of plan participants.
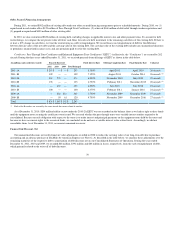
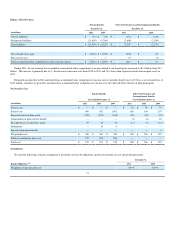
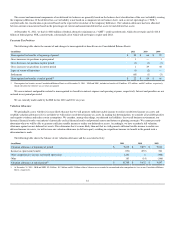
Net Periodic Cost
Pension Benefits Other Postretirement and
Postemployment Benefits
Year Ended December 31, Year Ended December 31,
(in millions) 2011 2010 2009 2011 2010 2009
Service cost $ — $ — $ — $ 52 $ 58 $ 53
Interest cost 969 982 1,002 180 196 207
Expected return on plan assets (724) (677) (615) (90) (90) (79)
Amortization of prior service benefit — — — (3) (4) 18
Recognized net actuarial loss (gain) 55 48 33 (11) (4) (18)
Settlements — 14 9 — — —
Special termination benefits — — — — — 6
Net periodic cost $ 300 $ 367 $ 429 $ 128 $ 156 $ 187
Defined contribution plan costs 377 334 306 — — —
Total cost $ 677 $ 701 $ 735 $ 128 $ 156 $ 187
Assumptions
We used the following actuarial assumptions to determine our benefit obligations and our net periodic cost for the periods presented:
December 31,
Benefit Obligations(1)(2) 2011 2010
Weighted average discount rate 4.94% 5.69%
77