Delta Airlines 2011 Annual Report Download - page 66
Download and view the complete annual report
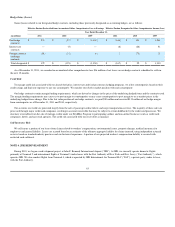
Please find page 66 of the 2011 Delta Airlines annual report below. You can navigate through the pages in the report by either clicking on the pages listed below, or by using the keyword search tool below to find specific information within the annual report.-
 1
1 -
2
-
3
-
4
-
5
-
6
-
7
-
8
-
9
-
10
-
11
-
12
-
13
-
14
-
15
-
16
-
17
-
18
-
19
-
20
-
21
-
22
-
23
-
24
-
25
-
26
-
27
-
28
-
29
-
30
-
31
-
32
-
33
-
34
-
35
-
36
-
37
-
38
-
39
-
40
-
41
-
42
-
43
-
44
-
45
-
46
-
47
-
48
-
49
-
50
-
51
-
52
-
53
-
54
-
55
-
 56
56 -
 57
57 -
 58
58 -
 59
59 -
 60
60 -
 61
61 -
 62
62 -
 63
63 -
 64
64 -
 65
65 -
 66
66 -
 67
67 -
 68
68 -
 69
69 -
 70
70 -
 71
71 -
 72
72 -
 73
73 -
 74
74 -
 75
75 -
 76
76 -
77
-
78
-
79
-
80
-
81
-
82
-
83
-
84
-
85
-
86
-
87
-
88
-
89
-
90
-
91
-
92
-
93
-
94
-
95
-
96
-
97
-
98
-
99
-
100
-
101
-
102
-
103
-
104
-
105
-
106
-
107
-
108
-
109
-
110
-
111
-
112
-
113
-
114
-
115
-
116
-
117
-
118
-
119
-
120
-
121
-
122
-
123
-
124
-
125
-
126
-
127
-
128
-
129
-
130
-
131
-
132
-
133
-
134
-
135
-
136
-
137
-
138
-
139
-
140
-
141
-
142
-
143
-
144
 |
 |

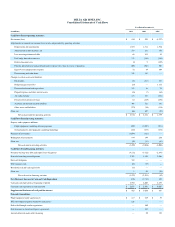
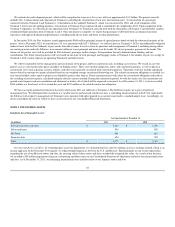
(in millions) December 31, 2010 Level 1 Level 2 Level 3 Valuation
Technique
Cash equivalents $ 2,696 $ 2,696 $ — $ — (a)
Short-term investments 718 718 — — (a)
Restricted cash equivalents and short-term investments 440 440 — — (a)
Long-term investments 144 — 25 119 (a)(c)
Hedge derivatives, net
Fuel hedge contracts 351 — 351 — (a)(c)
Interest rate contracts (74) — (74) — (a)(c)
Foreign currency exchange contracts (96) — (96) — (a)
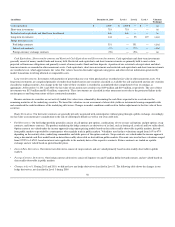
Cash Equivalents, Short-term Investments and Restricted Cash Equivalents and Short-term Investments. Cash equivalents and short-term investments
generally consist of money market funds and treasury bills. Restricted cash equivalents and short-term investments are primarily held to meet certain
projected self-insurance obligations and generally consist of money market funds and time deposits. A portion of our restricted cash equivalents and short-
term investments are recorded in other noncurrent assets. Cash equivalents, short-term investments and restricted cash equivalents and short-term investments
are recorded at cost, which approximates fair value. Fair value is based on the market approach using prices and other relevant information generated by
market transactions involving identical or comparable assets.
Long-term Investments. Investments with maturities of greater than one year when purchased are recorded at fair value in other noncurrent assets. Our
long-term investments are comprised primarily of student loan backed auction rate securities classified as available-for-sale and insured auction rate securities
classified as trading securities. Any change in the fair value of these securities is recorded in accumulated other comprehensive loss or earnings, as
appropriate. At December 31, 2011 and 2010, the fair value of our auction rate securities was $109 million and $119 million, respectively. The cost of these
investments was $133 million and $143 million, respectively. These investments are classified in other noncurrent assets due to the protracted failure in the
auction process and long-term nature of these contractual maturities.
Because auction rate securities are not actively traded, fair values were estimated by discounting the cash flows expected to be received over the
remaining maturities of the underlying securities. We based the valuations on our assessment of observable yields on instruments bearing comparable risks
and considered the creditworthiness of the underlying debt issuer. Changes in market conditions could result in further adjustments to the fair value of these
securities.
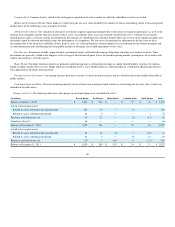
Hedge Derivatives. Our derivative contracts are generally privately negotiated with counterparties without going through a public exchange. Accordingly,
our fair value assessments give consideration to the risk of counterparty default (as well as our own credit risk).
•Fuel Derivatives. Our fuel hedge portfolio generally consists of call options; put options, combinations of two or more call options and put options; swap
contracts; and futures contracts. The products underlying the hedge contracts are derivatives of jet fuel, such as heating oil, crude oil and low sulfur diesel.
Option contracts are valued under the income approach using option pricing models based on data either readily observable in public markets, derived
from public markets or provided by counterparties who regularly trade in public markets. Volatilities used in these valuations ranged from 16% to 47%
depending on the maturity dates, underlying commodities and strike prices of the option contracts. Swap contracts are valued under the income approach
using a discounted cash flow model based on data either readily observable or derived from public markets. Discount rates used in these valuations ranged
from 0.295% to 0.676% based on interest rates applicable to the maturity dates of the respective contracts. Futures contracts are traded on a public
exchange and are valued based on quoted market prices.
•Interest Rate Derivatives. Our interest rate derivatives consist of swap contracts and are valued primarily based on data readily observable in public
markets.
•Foreign Currency Derivatives. Our foreign currency derivatives consist of Japanese yen and Canadian dollar forward contracts and are valued based on
data readily observable in public markets.
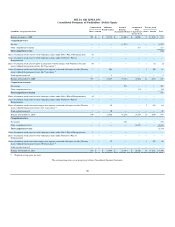
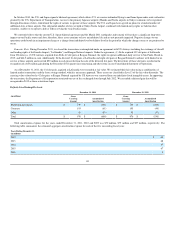
•Changes in Level 3. During 2011 and 2010, we did not have any hedge derivatives classified in Level 3. The following table shows the changes in our
hedge derivatives, net classified in Level 3 during 2009:
58