Delta Airlines 2011 Annual Report Download - page 29
Download and view the complete annual report
Please find page 29 of the 2011 Delta Airlines annual report below. You can navigate through the pages in the report by either clicking on the pages listed below, or by using the keyword search tool below to find specific information within the annual report.-
 1
1 -
2
-
3
-
4
-
5
-
6
-
7
-
8
-
9
-
10
-
11
-
12
-
13
-
14
-
15
-
16
-
17
-
18
-
 19
19 -
 20
20 -
 21
21 -
 22
22 -
 23
23 -
 24
24 -
 25
25 -
 26
26 -
 27
27 -
 28
28 -
 29
29 -
 30
30 -
 31
31 -
 32
32 -
 33
33 -
 34
34 -
 35
35 -
 36
36 -
 37
37 -
 38
38 -
 39
39 -
40
-
41
-
42
-
43
-
44
-
45
-
46
-
47
-
48
-
49
-
50
-
51
-
52
-
53
-
54
-
55
-
56
-
57
-
58
-
59
-
60
-
61
-
62
-
63
-
64
-
65
-
66
-
67
-
68
-
69
-
70
-
71
-
72
-
73
-
74
-
75
-
76
-
77
-
78
-
79
-
80
-
81
-
82
-
83
-
84
-
85
-
86
-
87
-
88
-
89
-
90
-
91
-
92
-
93
-
94
-
95
-
96
-
97
-
98
-
99
-
100
-
101
-
102
-
103
-
104
-
105
-
106
-
107
-
108
-
109
-
110
-
111
-
112
-
113
-
114
-
115
-
116
-
117
-
118
-
119
-
120
-
121
-
122
-
123
-
124
-
125
-
126
-
127
-
128
-
129
-
130
-
131
-
132
-
133
-
134
-
135
-
136
-
137
-
138
-
139
-
140
-
141
-
142
-
143
-
144
 |
 |

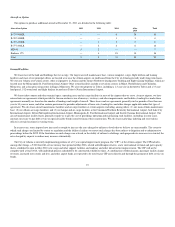
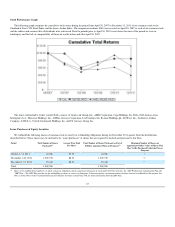
Stock Performance Graph
The following graph compares the cumulative total returns during the period from April 30, 2007 to December 31, 2011 of our common stock to the
Standard & Poor's 500 Stock Index and the Amex Airline Index. The comparison assumes $100 was invested on April 30, 2007 in each of our common stock
and the indices and assumes that all dividends were reinvested. Data for periods prior to April 30, 2007 is not shown because of the period we were in
bankruptcy and the lack of comparability of financial results before and after April 30, 2007.
The Amex Airline Index (ticker symbol XAL) consists of Alaska Air Group, Inc., AMR Corporation, Copa Holdings SA, Delta, GOL Linhas Areas
Inteligentes S.A., Hawaiian Holdings, Inc., JetBlue Airways Corporation, LAN Airlines SA, Ryanair Holdings plc, SkyWest, Inc., Southwest Airlines
Company, TAM S.A., United Continental Holdings, Inc. and US Airways Group, Inc.
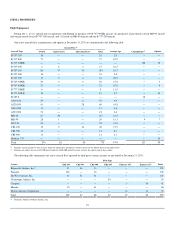
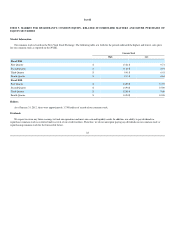
Issuer Purchases of Equity Securities
We withheld the following shares of common stock to satisfy tax withholding obligations during the December 2011 quarter from the distributions
described below. These shares may be deemed to be “issuer purchases” of shares that are required to be disclosed pursuant to this Item.
Period Total Number of Shares
Purchased(1) Average Price Paid
Per Share Total Number of Shares Purchased as Part of
Publicly Announced Plans or Programs(1) Maximum Number of Shares (or
Approximate Dollar Value) of Shares That
May Yet Be Purchased Under the Plan or
Programs
October 1-31, 2011 24,048 $7.74 24,048 (1)
November 1-30, 2011 1,922,778 $8.33 1,922,778 (1)
December 1-31, 2011 15,442 $8.31 15,442 (1)
Total 1,962,268 1,962,268
(1) Shares were withheld from employees to satisfy certain tax obligations due in connection with grants of stock under the Delta Air Lines, Inc. 2007 Performance Compensation Plan (the
"2007 Plan"). The 2007 Plan provides for the withholding of shares to satisfy tax obligations. It does not specify a maximum number of shares that can be withheld for this purpose. See
Note 12 of the Notes to the Consolidated Financial Statements elsewhere in this Form 10-K for more information about the 2007 Plan.
23