Delta Airlines 2011 Annual Report Download - page 53
Download and view the complete annual report
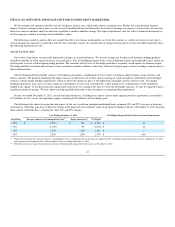
Please find page 53 of the 2011 Delta Airlines annual report below. You can navigate through the pages in the report by either clicking on the pages listed below, or by using the keyword search tool below to find specific information within the annual report.-
 1
1 -
2
-
3
-
4
-
5
-
6
-
7
-
8
-
9
-
10
-
11
-
12
-
13
-
14
-
15
-
16
-
17
-
18
-
19
-
20
-
21
-
22
-
23
-
24
-
25
-
26
-
27
-
28
-
29
-
30
-
31
-
32
-
33
-
34
-
35
-
36
-
37
-
38
-
39
-
40
-
41
-
42
-
 43
43 -
 44
44 -
 45
45 -
 46
46 -
 47
47 -
 48
48 -
 49
49 -
 50
50 -
 51
51 -
 52
52 -
 53
53 -
 54
54 -
 55
55 -
 56
56 -
 57
57 -
 58
58 -
 59
59 -
 60
60 -
 61
61 -
 62
62 -
 63
63 -
64
-
65
-
66
-
67
-
68
-
69
-
70
-
71
-
72
-
73
-
74
-
75
-
76
-
77
-
78
-
79
-
80
-
81
-
82
-
83
-
84
-
85
-
86
-
87
-
88
-
89
-
90
-
91
-
92
-
93
-
94
-
95
-
96
-
97
-
98
-
99
-
100
-
101
-
102
-
103
-
104
-
105
-
106
-
107
-
108
-
109
-
110
-
111
-
112
-
113
-
114
-
115
-
116
-
117
-
118
-
119
-
120
-
121
-
122
-
123
-
124
-
125
-
126
-
127
-
128
-
129
-
130
-
131
-
132
-
133
-
134
-
135
-
136
-
137
-
138
-
139
-
140
-
141
-
142
-
143
-
144
 |
 |
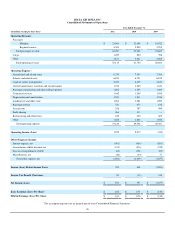
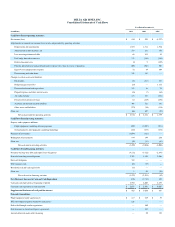
DELTA AIR LINES, INC.
Consolidated Balance Sheets
December 31,
(in millions, except share data) 2011 2010
ASSETS
Current Assets:
Cash and cash equivalents $ 2,657 $ 2,892
Short-term investments 958 718
Restricted cash, cash equivalents and short-term investments 305 409
Accounts receivable, net of an allowance for uncollectible accounts of $33 and $40
at December 31, 2011 and 2010, respectively
1,563 1,456
Expendable parts and supplies inventories, net of an allowance for obsolescence of $101 and $104
at December 31, 2011 and 2010, respectively
367 318
Deferred income taxes, net 461 355
Prepaid expenses and other 1,418 1,159
Total current assets 7,729 7,307
Property and Equipment, Net:
Property and equipment, net of accumulated depreciation and amortization of $5,472 and $4,164
at December 31, 2011 and 2010, respectively
20,223 20,307
Other Assets:
Goodwill 9,794 9,794
Identifiable intangibles, net of accumulated amortization of $600 and $530
at December 31, 2011 and 2010, respectively
4,751 4,749
Other noncurrent assets 1,002 1,031
Total other assets 15,547 15,574
Total assets $ 43,499 $ 43,188
LIABILITIES AND STOCKHOLDERS' (DEFICIT) EQUITY
Current Liabilities:
Current maturities of long-term debt and capital leases $ 1,944 $ 2,073
Air traffic liability 3,480 3,306
Accounts payable 1,600 1,713
Frequent flyer deferred revenue 1,849 1,690
Accrued salaries and related benefits 1,367 1,370
Taxes payable 594 579
Other accrued liabilities 1,867 654
Total current liabilities 12,701 11,385
Noncurrent Liabilities:
Long-term debt and capital leases 11,847 13,179
Pension, postretirement and related benefits 14,200 11,493
Frequent flyer deferred revenue 2,700 2,777
Deferred income taxes, net 2,028 1,924
Other noncurrent liabilities 1,419 1,533
Total noncurrent liabilities 32,194 30,906
Commitments and Contingencies
Stockholders' (Deficit) Equity:
Common stock at $0.0001 par value; 1,500,000,000 shares authorized, 861,499,734 and 847,716,723
shares issued at December 31, 2011 and 2010, respectively
— —
Additional paid-in capital 13,999 13,926
Accumulated deficit (8,398) (9,252)
Accumulated other comprehensive loss (6,766) (3,578)
Treasury stock, at cost, 16,253,791 and 12,993,100 shares at December 31, 2011 and 2010, respectively (231) (199)
Total stockholders' (deficit) equity (1,396) 897