Delta Airlines 2011 Annual Report Download - page 37
Download and view the complete annual report
Please find page 37 of the 2011 Delta Airlines annual report below. You can navigate through the pages in the report by either clicking on the pages listed below, or by using the keyword search tool below to find specific information within the annual report.-
 1
1 -
2
-
3
-
4
-
5
-
6
-
7
-
8
-
9
-
10
-
11
-
12
-
13
-
14
-
15
-
16
-
17
-
18
-
19
-
20
-
21
-
22
-
23
-
24
-
25
-
26
-
 27
27 -
 28
28 -
 29
29 -
 30
30 -
 31
31 -
 32
32 -
 33
33 -
 34
34 -
 35
35 -
 36
36 -
 37
37 -
 38
38 -
 39
39 -
 40
40 -
 41
41 -
 42
42 -
 43
43 -
 44
44 -
 45
45 -
 46
46 -
 47
47 -
48
-
49
-
50
-
51
-
52
-
53
-
54
-
55
-
56
-
57
-
58
-
59
-
60
-
61
-
62
-
63
-
64
-
65
-
66
-
67
-
68
-
69
-
70
-
71
-
72
-
73
-
74
-
75
-
76
-
77
-
78
-
79
-
80
-
81
-
82
-
83
-
84
-
85
-
86
-
87
-
88
-
89
-
90
-
91
-
92
-
93
-
94
-
95
-
96
-
97
-
98
-
99
-
100
-
101
-
102
-
103
-
104
-
105
-
106
-
107
-
108
-
109
-
110
-
111
-
112
-
113
-
114
-
115
-
116
-
117
-
118
-
119
-
120
-
121
-
122
-
123
-
124
-
125
-
126
-
127
-
128
-
129
-
130
-
131
-
132
-
133
-
134
-
135
-
136
-
137
-
138
-
139
-
140
-
141
-
142
-
143
-
144
 |
 |

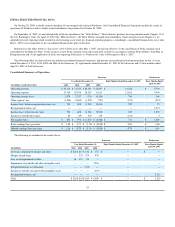
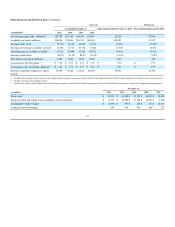
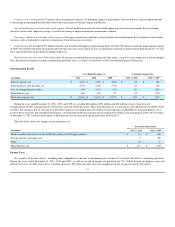
Results of Operations - 2010 Compared to 2009
Operating Revenue
Year Ended December 31, Increase
(Decrease) % Increase
(Decrease)
(in millions) 2010 2009
Passenger:
Mainline $ 21,408 $ 18,522 $ 2,886 16%
Regional carriers 5,850 5,285 565 11%
Total passenger revenue 27,258 23,807 3,451 14%
Cargo 850 788 62 8%
Other 3,647 3,468 179 5%
Total operating revenue $ 31,755 $ 28,063 $ 3,692 13%
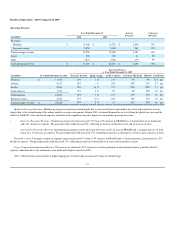
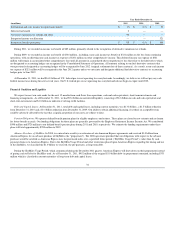
Increase (Decrease)
vs. Year Ended December 31, 2009
(in millions) Year Ended December 31, 2010 Passenger Revenue RPMs (Traffic) ASMs (Capacity) Passenger Mile Yield PRASM Load Factor
Domestic $ 11,878 11% 1 % 2 % 9% 9% (0.3) pts
Atlantic 5,152 18% — % (3)% 18% 21% 2.3 pts
Pacific 2,806 38% 14 % 9 % 21% 26% 7.3 pts
Latin America 1,572 13% 4 % 3 % 8% 10% 1.0 pts
Total mainline 21,408 16% 3 % 2 % 12% 14% 1.0 pts
Regional carriers 5,850 11% (1)% (2)% 12% 13% 1.0 pts
Total passenger revenue $ 27,258 14% 2 % 1 % 12% 13% 1.0 pts
Mainline Passenger Revenue. Mainline passenger revenue increased primarily due to increased business demand for air travel and an increase in fares,
largely due to the strengthening of the airline industry revenue environment. During 2009, weakened demand for air travel from the global recession and the
effects of the H1N1 virus and related capacity reductions had a significant negative impact on our mainline passenger revenue.
•Domestic Passenger Revenue . Domestic passenger revenue increased 11% from a 9% increase in PRASM on a 0.3 point decrease in load factor
and a 2% increase in capacity. The passenger mile yield increased 9%, reflecting an increase in business travel and an increase in fares.
•International Passenger Revenue. International passenger revenue increased 22% from a 21% increase in PRASM and a 2.4 point increase in load
factor on a 1% increase in capacity. The passenger mile yield increased 17%, reflecting an increase in demand for air travel and an increase in fares.
Regional carriers. Passenger revenue of regional carriers increased 11% from a 13% increase in PRASM and a 1.0 point increase in load factor on a 2%
decline in capacity. The passenger mile yield increased 12%, reflecting an increase in demand for air travel and an increase in fares.
Cargo. Cargo revenue increased due to a 13% increase in yield and a 25% increase in volume, primarily in international markets, partially offset by
capacity reductions due to the retirement of our dedicated freighter aircraft in 2009.
Other. Other revenue increased due to higher baggage fee revenue from an increased volume of checked bags.
31