Delta Airlines 2011 Annual Report Download - page 67
Download and view the complete annual report
Please find page 67 of the 2011 Delta Airlines annual report below. You can navigate through the pages in the report by either clicking on the pages listed below, or by using the keyword search tool below to find specific information within the annual report.-
 1
1 -
2
-
3
-
4
-
5
-
6
-
7
-
8
-
9
-
10
-
11
-
12
-
13
-
14
-
15
-
16
-
17
-
18
-
19
-
20
-
21
-
22
-
23
-
24
-
25
-
26
-
27
-
28
-
29
-
30
-
31
-
32
-
33
-
34
-
35
-
36
-
37
-
38
-
39
-
40
-
41
-
42
-
43
-
44
-
45
-
46
-
47
-
48
-
49
-
50
-
51
-
52
-
53
-
54
-
55
-
56
-
 57
57 -
 58
58 -
 59
59 -
 60
60 -
 61
61 -
 62
62 -
 63
63 -
 64
64 -
 65
65 -
 66
66 -
 67
67 -
 68
68 -
 69
69 -
 70
70 -
 71
71 -
 72
72 -
 73
73 -
 74
74 -
 75
75 -
 76
76 -
 77
77 -
78
-
79
-
80
-
81
-
82
-
83
-
84
-
85
-
86
-
87
-
88
-
89
-
90
-
91
-
92
-
93
-
94
-
95
-
96
-
97
-
98
-
99
-
100
-
101
-
102
-
103
-
104
-
105
-
106
-
107
-
108
-
109
-
110
-
111
-
112
-
113
-
114
-
115
-
116
-
117
-
118
-
119
-
120
-
121
-
122
-
123
-
124
-
125
-
126
-
127
-
128
-
129
-
130
-
131
-
132
-
133
-
134
-
135
-
136
-
137
-
138
-
139
-
140
-
141
-
142
-
143
-
144
 |
 |

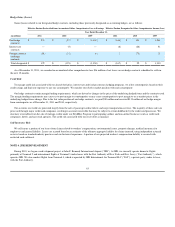
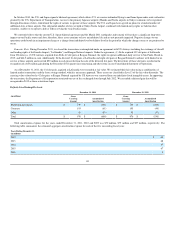
(in millions) Hedge Derivatives,
Net
Balance at January 1, 2009 $ (1,091)
Change in fair value included in other comprehensive income 1,230
Change in fair value included in earnings:
Aircraft fuel and related taxes (1,263)
Miscellaneous, net 31
Purchases and settlements, net 1,199
Transfers from Level 3(1) (106)
Balance at December 31, 2009 $ —
(1) During 2009, we implemented systems that better provide for the evaluation of certain inputs against market data. As a result, we reclassified our option contracts to Level 2.
For additional information regarding the composition and classification of our derivative contracts, see Note 3.
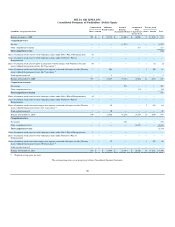
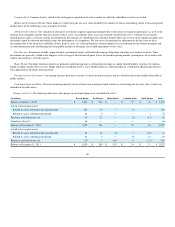
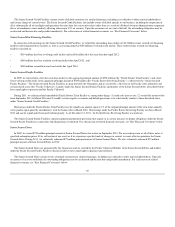
Benefit Plan Assets. Benefit plan assets relate to our defined benefit pension plans and certain of our postemployment benefit plans that are funded
through trusts. The following table shows our benefit plan assets by asset class. These investments are presented net of the related benefit obligation in
pension, postretirement, and related benefits. For additional information regarding benefit plan assets, see Note 10.
December 31, 2011 December 31, 2010
(in millions) Total Level 1 Level 2 Level 3 Valuation Technique Total Level 1 Level 2 Level 3 Valuation Technique
Common stock
U.S. $ 796 $ 796 $ — $ — (a) $ 1,427 $ 1,402 $ 25 $ — (a)
Non-U.S. 910 875 — 35 (a) 1,090 1,058 — 32 (a)
Mutual funds
U.S. 18 — 18 — (a) 1 1 — — (a)
Non-U.S. 246 21 225 — (a) — — — — (a)
Non-U.S. emerging markets 2 — 2 — (a) 314 — 314 — (a)
Diversified fixed income 426 — 426 — (a) 222 — 222 — (a)
High yield 58 — 58 — (a)(c) 209 — 209 — (a)(c)
Commingled funds
U.S. 917 — 917 — (a) 1,776 — 1,776 — (a)
Non-U.S. 783 — 783 — (a) 514 — 514 — (a)
Non-U.S. emerging markets — — — — (a) 135 — 135 — (a)
Diversified fixed income 776 — 776 — (a) 458 — 458 — (a)
High yield 92 — 92 — (a) 93 — 93 — (a)
Alternative investments
Private equity 1,620 — — 1,620 (a)(c) 1,559 — — 1,559 (a)(c)
Real estate and natural resources 424 — — 424 (a)(c) 396 — — 396 (a)(c)
Hedge Funds 432 — — 432 (a)(c) — — — —
Fixed income 764 — 753 11 (a)(c) 551 — 511 40 (a)(c)
Foreign currency derivatives
Assets 738 — 738 — (a) 879 — 879 — (a)
Liabilities (735) — (735) — (a) (874) — (874) — (a)
Cash equivalents and other 447 46 401 — (a) 609 52 557 — (a)
Total benefit plan assets $ 8,714 $ 1,738 $ 4,454 $ 2,522 $ 9,359 $ 2,513 $ 4,819 $ 2,027
59