Cricket Wireless 2012 Annual Report Download - page 97
Download and view the complete annual report
Please find page 97 of the 2012 Cricket Wireless annual report below. You can navigate through the pages in the report by either clicking on the pages listed below, or by using the keyword search tool below to find specific information within the annual report.-
 1
1 -
2
-
3
-
4
-
5
-
6
-
7
-
8
-
9
-
10
-
11
-
12
-
13
-
14
-
15
-
16
-
17
-
18
-
19
-
20
-
21
-
22
-
23
-
24
-
25
-
26
-
27
-
28
-
29
-
30
-
31
-
32
-
33
-
34
-
35
-
36
-
37
-
38
-
39
-
40
-
41
-
42
-
43
-
44
-
45
-
46
-
47
-
48
-
49
-
50
-
51
-
52
-
53
-
54
-
55
-
56
-
57
-
58
-
59
-
60
-
61
-
62
-
63
-
64
-
65
-
66
-
67
-
68
-
69
-
70
-
71
-
72
-
73
-
74
-
75
-
76
-
77
-
78
-
79
-
80
-
81
-
82
-
83
-
84
-
85
-
86
-
 87
87 -
 88
88 -
 89
89 -
 90
90 -
 91
91 -
 92
92 -
 93
93 -
 94
94 -
 95
95 -
 96
96 -
 97
97 -
 98
98 -
 99
99 -
 100
100 -
 101
101 -
 102
102 -
 103
103 -
 104
104 -
 105
105 -
 106
106 -
 107
107 -
108
-
109
-
110
-
111
-
112
-
113
-
114
-
115
-
116
-
117
-
118
-
119
-
120
-
121
-
122
-
123
-
124
-
125
-
126
-
127
-
128
-
129
-
130
-
131
-
132
-
133
-
134
-
135
-
136
-
137
-
138
-
139
-
140
-
141
-
142
-
143
-
144
-
145
-
146
-
147
-
148
-
149
-
150
-
151
-
152
-
153
-
154
-
155
-
156
-
157
-
158
-
159
-
160
-
161
-
162
-
163
-
164
 |
 |

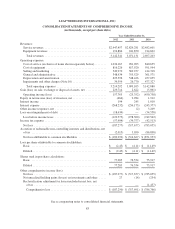
LEAP WIRELESS INTERNATIONAL, INC.
CONSOLIDATED STATEMENTS OF COMPREHENSIVE INCOME
(in thousands, except per share data)
Year Ended December 31,
2012 2011 2010
Revenues:
Service revenues .......................................... $2,947,457 $2,829,281 $2,482,601
Equipment revenues ....................................... 194,884 241,850 214,602
Total revenues .......................................... 3,142,341 3,071,131 2,697,203
Operating expenses:
Cost of service (exclusive of items shown separately below) ........ 1,034,167 981,203 840,635
Cost of equipment ......................................... 816,226 817,920 591,994
Selling and marketing ...................................... 349,970 369,257 414,318
General and administrative .................................. 348,934 355,529 361,571
Depreciation and amortization ............................... 625,596 548,426 457,035
Impairments and other charges (Note 10) ....................... 39,399 26,770 477,327
Total operating expenses .................................. 3,214,292 3,099,105 3,142,880
Gain (loss) on sale, exchange or disposal of assets, net .............. 229,714 2,622 (5,061)
Operating income (loss) .................................... 157,763 (25,352) (450,738)
Equity in net income (loss) of investees, net ....................... (464) 2,984 1,912
Interest income ............................................. 194 245 1,010
Interest expense ............................................. (268,232) (256,175) (243,377)
Other income (expense), net ................................... — (2) 3,209
Loss on extinguishment of debt ................................ (18,634) — (54,558)
Loss before income taxes ................................... (129,373) (278,300) (742,542)
Income tax expense .......................................... (57,904) (39,377) (42,513)
Net loss ................................................. (187,277) (317,677) (785,055)
Accretion of redeemable non-controlling interests and distributions, net
oftax ................................................... (2,015) 3,050 (86,898)
Net loss attributable to common stockholders ................... $ (189,292) $ (314,627) $ (871,953)
Loss per share attributable to common stockholders:
Basic ................................................... $ (2.45) $ (4.11) $ (11.49)
Diluted .................................................. $ (2.45) $ (4.11) $ (11.49)
Shares used in per share calculations:
Basic ................................................... 77,283 76,534 75,917
Diluted .................................................. 77,283 76,534 75,917
Other comprehensive income (loss):
Net loss ................................................. $ (187,277) $ (317,677) $ (785,055)
Net unrealized holding gains (losses) on investments and other ..... 27 (14) (254)
Reclassification adjustment for losses included in net loss, net
oftax ................................................. — — (1,457)
Comprehensive loss ...................................... $ (187,250) $ (317,691) $ (786,766)
See accompanying notes to consolidated financial statements.
83