Cricket Wireless 2012 Annual Report Download - page 89
Download and view the complete annual report
Please find page 89 of the 2012 Cricket Wireless annual report below. You can navigate through the pages in the report by either clicking on the pages listed below, or by using the keyword search tool below to find specific information within the annual report.-
 1
1 -
2
-
3
-
4
-
5
-
6
-
7
-
8
-
9
-
10
-
11
-
12
-
13
-
14
-
15
-
16
-
17
-
18
-
19
-
20
-
21
-
22
-
23
-
24
-
25
-
26
-
27
-
28
-
29
-
30
-
31
-
32
-
33
-
34
-
35
-
36
-
37
-
38
-
39
-
40
-
41
-
42
-
43
-
44
-
45
-
46
-
47
-
48
-
49
-
50
-
51
-
52
-
53
-
54
-
55
-
56
-
57
-
58
-
59
-
60
-
61
-
62
-
63
-
64
-
65
-
66
-
67
-
68
-
69
-
70
-
71
-
72
-
73
-
74
-
75
-
76
-
77
-
78
-
 79
79 -
 80
80 -
 81
81 -
 82
82 -
 83
83 -
 84
84 -
 85
85 -
 86
86 -
 87
87 -
 88
88 -
 89
89 -
 90
90 -
 91
91 -
 92
92 -
 93
93 -
 94
94 -
 95
95 -
 96
96 -
 97
97 -
 98
98 -
 99
99 -
100
-
101
-
102
-
103
-
104
-
105
-
106
-
107
-
108
-
109
-
110
-
111
-
112
-
113
-
114
-
115
-
116
-
117
-
118
-
119
-
120
-
121
-
122
-
123
-
124
-
125
-
126
-
127
-
128
-
129
-
130
-
131
-
132
-
133
-
134
-
135
-
136
-
137
-
138
-
139
-
140
-
141
-
142
-
143
-
144
-
145
-
146
-
147
-
148
-
149
-
150
-
151
-
152
-
153
-
154
-
155
-
156
-
157
-
158
-
159
-
160
-
161
-
162
-
163
-
164
 |
 |
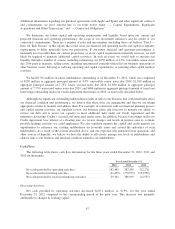
Total capital expenditures for 2013 are expected to be between $275 million and $325 million. These capital
expenditures are primarily expected to support the ongoing maintenance and development of our network and
other business assets, our deployment of LTE network technology and other capital projects.
We are generally targeting annual capital expenditures over the next several years to support the ongoing
maintenance and development of our network and other business assets (excluding capital expenditures relating
to LTE technology) in the amount of approximately 10% of annual service revenues. The actual amount of
capital expenditures we spend in future years for these purposes may vary as a result of numerous factors,
including our then-available capital resources and customer usage of our network resources.
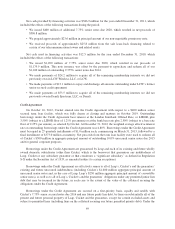
We have deployed LTE network technology across approximately 21 million POPs and are exploring cost-
effective ways to deliver LTE services to additional customers. We may deploy LTE across up to an additional
approximately 10 million POPs in our network footprint in 2013 (with such potential plans included in our
projected total capital expenditures for 2013 above). Capital expenditures for the deployment of LTE are
currently anticipated to be less than $10 per covered POP. In addition, we have entered into LTE roaming and
wholesale arrangements and we may enter into partnerships or joint ventures with other carriers. We intend to be
disciplined as we pursue delivery of additional LTE services to our customers and to remain focused on our
position as a low-cost provider of wireless telecommunications. The extent to which we pursue additional
facilities-based LTE coverage and the actual amount we spend will depend upon multiple factors, including the
scope and pace of any deployment activities and the availability of partnerships or joint ventures with others.
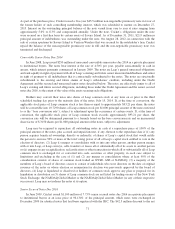
Other Transactions
On November 26, 2012, we entered into an intra-market license exchange agreement with a subsidiary of T-
Mobile USA, Inc., or T-Mobile, and Verizon Wireless involving various markets in Philadelphia, Wilmington and
Atlantic City. Completion of the license exchange is subject to customary closing conditions, including the consent of
the FCC. The wireless licenses to be transferred under the license exchange agreements have been classified in assets
held for sale at their carrying value of $136.2 million in the consolidated balance sheets as of December 31, 2012.
On October 1, 2012, we assigned to various entities affiliated with T-Mobile spectrum in various markets in
Alabama, Illinois, Missouri, Minnesota and Wisconsin in exchange for 10 MHz of additional AWS spectrum in
Phoenix, Houston and two other Texas markets. The transactions also included intra-market exchanges between
us and T-Mobile in Philadelphia, Wilmington, Atlantic City and various markets in Texas and New Mexico. We
recognized a non-cash gain on the transaction of approximately $106.4 million related to the excess of the fair
value over carrying value of the spectrum exchanged by us in the transaction.
On August 28, 2012, we purchased 12 MHz of 700 MHz A block spectrum in Chicago from Verizon
Wireless for $204 million and we and Savary Island sold to Verizon Wireless excess PCS and AWS spectrum in
various markets across the U.S for $360 million. We recognized a net gain of $130.4 million in connection with
these transactions.
On November 30, 2011, we assigned 10 MHz of unused wireless spectrum in Indianapolis, IN, Minneapolis,
MN and Syracuse, NY to various entities affiliated with T-Mobile as part of a license exchange transaction. In
exchange, we received 10 MHz of additional wireless spectrum in seven existing Cricket markets in Texas,
Colorado, Oklahoma and New Mexico. In connection with the closing of this transaction, we recognized a non-
cash gain of approximately $20.5 million.
On June 30, 2011, one of our equity method investees declared a cash dividend and paid the dividend with
funds borrowed under a third-party line of credit. Our share of the dividend based on our ownership percentage
was $18.2 million and was received in full on July 1, 2011. In the consolidated statement of cash flows for the
year ended December 31, 2011, we presented the portion of the dividend equal to our share of accumulated
profits (approximately $6.6 million) as cash from operating activities and the remainder (approximately $11.6
million) as cash from investing activities, as it represented a return of our original investment.
75