Cricket Wireless 2012 Annual Report Download - page 55
Download and view the complete annual report
Please find page 55 of the 2012 Cricket Wireless annual report below. You can navigate through the pages in the report by either clicking on the pages listed below, or by using the keyword search tool below to find specific information within the annual report.-
 1
1 -
2
-
3
-
4
-
5
-
6
-
7
-
8
-
9
-
10
-
11
-
12
-
13
-
14
-
15
-
16
-
17
-
18
-
19
-
20
-
21
-
22
-
23
-
24
-
25
-
26
-
27
-
28
-
29
-
30
-
31
-
32
-
33
-
34
-
35
-
36
-
37
-
38
-
39
-
40
-
41
-
42
-
43
-
44
-
 45
45 -
 46
46 -
 47
47 -
 48
48 -
 49
49 -
 50
50 -
 51
51 -
 52
52 -
 53
53 -
 54
54 -
 55
55 -
 56
56 -
 57
57 -
 58
58 -
 59
59 -
 60
60 -
 61
61 -
 62
62 -
 63
63 -
 64
64 -
 65
65 -
66
-
67
-
68
-
69
-
70
-
71
-
72
-
73
-
74
-
75
-
76
-
77
-
78
-
79
-
80
-
81
-
82
-
83
-
84
-
85
-
86
-
87
-
88
-
89
-
90
-
91
-
92
-
93
-
94
-
95
-
96
-
97
-
98
-
99
-
100
-
101
-
102
-
103
-
104
-
105
-
106
-
107
-
108
-
109
-
110
-
111
-
112
-
113
-
114
-
115
-
116
-
117
-
118
-
119
-
120
-
121
-
122
-
123
-
124
-
125
-
126
-
127
-
128
-
129
-
130
-
131
-
132
-
133
-
134
-
135
-
136
-
137
-
138
-
139
-
140
-
141
-
142
-
143
-
144
-
145
-
146
-
147
-
148
-
149
-
150
-
151
-
152
-
153
-
154
-
155
-
156
-
157
-
158
-
159
-
160
-
161
-
162
-
163
-
164
 |
 |

PART II
FINANCIAL INFORMATION
Item 5. Market for Registrant’s Common Equity, Related Stockholder Matters and Issuer Purchases of
Equity Securities
Market Price of and Dividends on the Registrant’s Common Equity and Related Stockholder Matters
Our common stock is listed for trading on the NASDAQ Global Select Market under “LEAP.”
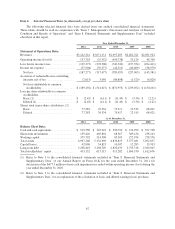
The following table sets forth the high and low closing prices per share of our common stock on the
NASDAQ Global Select Market for the quarterly periods indicated, which correspond to our quarterly fiscal
periods for financial reporting purposes.
High($) Low($)
Calendar Year — 2011
First Quarter ........................................................ 15.65 11.64
Second Quarter ...................................................... 17.20 14.72
Third Quarter ........................................................ 16.79 6.27
Fourth Quarter ....................................................... 9.45 5.83
Calendar Year — 2012
First Quarter ........................................................ 11.14 8.56
Second Quarter ...................................................... 8.78 4.78
Third Quarter ........................................................ 6.96 4.42
Fourth Quarter ....................................................... 7.59 5.18
On February 1, 2013, the last reported sale price of Leap common stock on the NASDAQ Global Select
Market was $6.02 per share. As of February 1, 2013, there were 79,134,930 shares of common stock outstanding
held by approximately 290 holders of record.
Dividends
Leap has not paid or declared any cash dividends on its common stock and we do not anticipate paying any
cash dividends on our common stock in the foreseeable future. As more fully described in “Item 7.
Management’s Discussion and Analysis of Financial Condition and Results of Operations,” the terms of our
Credit Agreement and the indentures governing our secured and unsecured senior notes restrict our ability to
declare or pay dividends. We intend to retain future earnings, if any, to fund our business operations. Any future
payment of dividends to our stockholders will depend on decisions that will be made by our board of directors
and will depend on then existing conditions, including our financial condition, contractual restrictions, capital
requirements and business prospects.
41