Cricket Wireless 2012 Annual Report Download - page 75
Download and view the complete annual report
Please find page 75 of the 2012 Cricket Wireless annual report below. You can navigate through the pages in the report by either clicking on the pages listed below, or by using the keyword search tool below to find specific information within the annual report.-
 1
1 -
2
-
3
-
4
-
5
-
6
-
7
-
8
-
9
-
10
-
11
-
12
-
13
-
14
-
15
-
16
-
17
-
18
-
19
-
20
-
21
-
22
-
23
-
24
-
25
-
26
-
27
-
28
-
29
-
30
-
31
-
32
-
33
-
34
-
35
-
36
-
37
-
38
-
39
-
40
-
41
-
42
-
43
-
44
-
45
-
46
-
47
-
48
-
49
-
50
-
51
-
52
-
53
-
54
-
55
-
56
-
57
-
58
-
59
-
60
-
61
-
62
-
63
-
64
-
 65
65 -
 66
66 -
 67
67 -
 68
68 -
 69
69 -
 70
70 -
 71
71 -
 72
72 -
 73
73 -
 74
74 -
 75
75 -
 76
76 -
 77
77 -
 78
78 -
 79
79 -
 80
80 -
 81
81 -
 82
82 -
 83
83 -
 84
84 -
 85
85 -
86
-
87
-
88
-
89
-
90
-
91
-
92
-
93
-
94
-
95
-
96
-
97
-
98
-
99
-
100
-
101
-
102
-
103
-
104
-
105
-
106
-
107
-
108
-
109
-
110
-
111
-
112
-
113
-
114
-
115
-
116
-
117
-
118
-
119
-
120
-
121
-
122
-
123
-
124
-
125
-
126
-
127
-
128
-
129
-
130
-
131
-
132
-
133
-
134
-
135
-
136
-
137
-
138
-
139
-
140
-
141
-
142
-
143
-
144
-
145
-
146
-
147
-
148
-
149
-
150
-
151
-
152
-
153
-
154
-
155
-
156
-
157
-
158
-
159
-
160
-
161
-
162
-
163
-
164
 |
 |

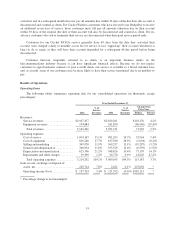
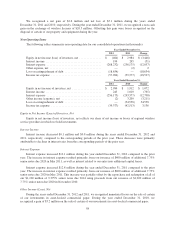
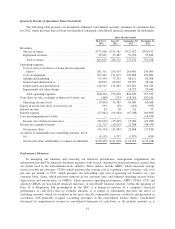
Quarterly Results of Operations Data (Unaudited)
The following table presents our unaudited condensed consolidated quarterly statement of operations data
for 2012, which has been derived from our unaudited condensed consolidated financial statements (in thousands):
Three Months Ended
March 31,
2012
June 30,
2012
September 30,
2012
December 31,
2012
Revenues:
Service revenues ................................. $773,998 $751,285 $722,022 $700,152
Equipment revenues .............................. 51,621 35,487 51,950 55,826
Total revenues ................................. 825,619 786,772 773,972 755,978
Operating expenses:
Cost of service (exclusive of items shown separately
below) ....................................... 261,311 256,555 266,401 249,900
Cost of equipment ................................ 247,847 171,673 203,846 192,860
Selling and marketing ............................. 95,554 77,247 88,111 89,058
General and administrative ......................... 89,699 94,892 85,997 78,346
Depreciation and amortization ...................... 146,543 154,483 161,821 162,749
Impairments and other charges ...................... — — 14,753 24,646
Total operating expenses ......................... 840,954 754,850 820,929 797,559
Gain (loss) on sale, exchange or disposal of assets, net ..... (468) (333) 128,366 102,149
Operating income (loss) ........................... (15,803) 31,589 81,409 60,568
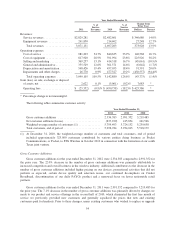
Equity in net income (loss) of investees, net ............. 193 (59) (203) (395)
Interest income .................................... 29 28 62 75
Interest expense .................................... (67,042) (66,983) (67,308) (66,899)
Loss on extinguishment of debt ....................... — — — (18,634)
Income (loss) before income taxes ................... (82,623) (35,425) 13,960 (25,285)
Income tax (expense) benefit ......................... (11,711) (10,562) 12,908 (48,539)
Net income (loss) ................................ (94,334) (45,987) 26,868 (73,824)
Accretion of redeemable non-controlling interests, net of
tax ............................................ (4,105) 4,397 (1,853) (454)
Net income (loss) attributable to common stockholders . . . $ (98,439) $ (41,590) $ 25,015 $ (74,278)
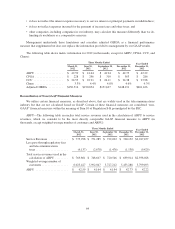
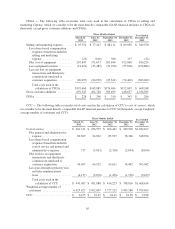
Performance Measures
In managing our business and assessing our financial performance, management supplements the
information provided by financial statement measures with several customer-focused performance metrics that
are widely used in the telecommunications industry. These metrics include ARPU, which measures average
service revenue per customer; CPGA, which measures the average cost of acquiring a new customer; cash costs
per user per month, or CCU, which measures the non-selling cash cost of operating our business on a per
customer basis; churn, which measures turnover in our customer base; and adjusted operating income before
depreciation and amortization, or OIBDA, which measures operating performance. ARPU, CPGA, CCU and
adjusted OIBDA are non-GAAP financial measures. A non-GAAP financial measure, within the meaning of
Item 10 of Regulation S-K promulgated by the SEC, is a numerical measure of a company’s financial
performance or cash flows that (a) excludes amounts, or is subject to adjustments that have the effect of
excluding amounts, which are included in the most directly comparable measure calculated and presented in
accordance with generally accepted accounting principles in the consolidated balance sheets, consolidated
statements of comprehensive income or consolidated statements of cash flows; or (b) includes amounts, or is
61