Cricket Wireless 2012 Annual Report Download - page 68
Download and view the complete annual report
Please find page 68 of the 2012 Cricket Wireless annual report below. You can navigate through the pages in the report by either clicking on the pages listed below, or by using the keyword search tool below to find specific information within the annual report.-
 1
1 -
2
-
3
-
4
-
5
-
6
-
7
-
8
-
9
-
10
-
11
-
12
-
13
-
14
-
15
-
16
-
17
-
18
-
19
-
20
-
21
-
22
-
23
-
24
-
25
-
26
-
27
-
28
-
29
-
30
-
31
-
32
-
33
-
34
-
35
-
36
-
37
-
38
-
39
-
40
-
41
-
42
-
43
-
44
-
45
-
46
-
47
-
48
-
49
-
50
-
51
-
52
-
53
-
54
-
55
-
56
-
57
-
 58
58 -
 59
59 -
 60
60 -
 61
61 -
 62
62 -
 63
63 -
 64
64 -
 65
65 -
 66
66 -
 67
67 -
 68
68 -
 69
69 -
 70
70 -
 71
71 -
 72
72 -
 73
73 -
 74
74 -
 75
75 -
 76
76 -
 77
77 -
 78
78 -
79
-
80
-
81
-
82
-
83
-
84
-
85
-
86
-
87
-
88
-
89
-
90
-
91
-
92
-
93
-
94
-
95
-
96
-
97
-
98
-
99
-
100
-
101
-
102
-
103
-
104
-
105
-
106
-
107
-
108
-
109
-
110
-
111
-
112
-
113
-
114
-
115
-
116
-
117
-
118
-
119
-
120
-
121
-
122
-
123
-
124
-
125
-
126
-
127
-
128
-
129
-
130
-
131
-
132
-
133
-
134
-
135
-
136
-
137
-
138
-
139
-
140
-
141
-
142
-
143
-
144
-
145
-
146
-
147
-
148
-
149
-
150
-
151
-
152
-
153
-
154
-
155
-
156
-
157
-
158
-
159
-
160
-
161
-
162
-
163
-
164
 |
 |

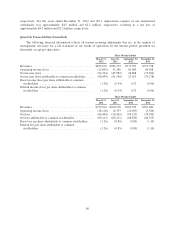
Year Ended December 31,
2011
%of
Service
Revenues 2010
%of
Service
Revenues
Change from
Prior Year
Dollars Percent
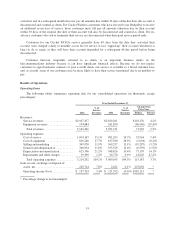
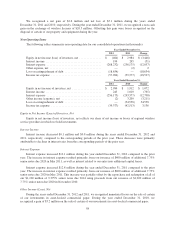
Revenues:
Service revenues ................... $2,829,281 $2,482,601 $ 346,680 14.0%
Equipment revenues ................ 241,850 214,602 27,248 12.7%
Total revenues .................. 3,071,131 2,697,203 373,928 13.9%
Operating expenses:
Cost of service .................... 981,203 34.7% 840,635 33.9% 140,568 16.7%
Cost of equipment .................. 817,920 28.9% 591,994 23.8% 225,926 38.2%
Selling and marketing ............... 369,257 13.1% 414,318 16.7% (45,061) (10.9)%
General and administrative ........... 355,529 12.6% 361,571 14.6% (6,042) (1.7)%
Depreciation and amortization ........ 548,426 19.4% 457,035 18.4% 91,391 20.0%
Impairments and other charges ........ 26,770 0.9% 477,327 19.2% (450,557) (94.4)%
Total operating expenses .......... 3,099,105 109.5% 3,142,880 126.6% (43,775) (1.4)%
Gain (loss) on sale, exchange or disposal
of assets, net ...................... 2,622 0.1% (5,061) (0.2)% 7,683 *
Operating loss ..................... $ (25,352) (0.9)% $ (450,738) (18.2)% $ 425,386 *
* Percentage change is not meaningful.
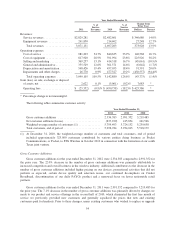
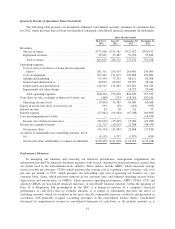
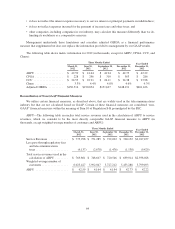
The following tables summarize customer activity:
Year Ended December 31,
2012 2011 2010
Gross customer additions ............................. 2,334,383 2,991,352 3,219,485
Net customer additions (losses) ........................ (637,229) 415,834 241,546
Weighted-average number of customers (1) ............... 5,799,493 5,724,152 5,239,638
Total customers, end of period ......................... 5,296,784 5,934,013 5,518,179
(1) At December 31, 2010, the weighted-average number of customers and total customers, end of period
included approximately 323,000 customers contributed by various entities doing business as Pocket
Communications, or Pocket, to STX Wireless in October 2010 in connection with the formation of our south
Texas joint venture.
Gross Customer Additions
Gross customer additions for the year ended December 31, 2012 were 2,334,383 compared to 2,991,352 for
the prior year. The 22.0% decrease in the number of gross customer additions was primarily attributable to
increased competition and overall softness in the wireless industry. Additional contributors to the decrease in the
number of gross customer additions included higher pricing on our devices, promotional activities that did not
perform as expected, certain device quality and selection issues, our continued de-emphasis on Cricket
Broadband, discontinuation of our daily PAYGo product and a narrowed focus on fewer nationwide retail
partners.
Gross customer additions for the year ended December 31, 2011 were 2,991,352 compared to 3,219,485 for
the prior year. The 7.1% decrease in the number of gross customer additions was primarily driven by changes we
made to our product and service offerings in the second half of 2010, which eliminated the first free month of
service we previously provided new customers and generally equalized the prices that new and existing
customers paid for handsets. Prior to these changes, many existing customers who wished to replace or upgrade
54