Cricket Wireless 2012 Annual Report Download - page 112
Download and view the complete annual report
Please find page 112 of the 2012 Cricket Wireless annual report below. You can navigate through the pages in the report by either clicking on the pages listed below, or by using the keyword search tool below to find specific information within the annual report.-
 1
1 -
2
-
3
-
4
-
5
-
6
-
7
-
8
-
9
-
10
-
11
-
12
-
13
-
14
-
15
-
16
-
17
-
18
-
19
-
20
-
21
-
22
-
23
-
24
-
25
-
26
-
27
-
28
-
29
-
30
-
31
-
32
-
33
-
34
-
35
-
36
-
37
-
38
-
39
-
40
-
41
-
42
-
43
-
44
-
45
-
46
-
47
-
48
-
49
-
50
-
51
-
52
-
53
-
54
-
55
-
56
-
57
-
58
-
59
-
60
-
61
-
62
-
63
-
64
-
65
-
66
-
67
-
68
-
69
-
70
-
71
-
72
-
73
-
74
-
75
-
76
-
77
-
78
-
79
-
80
-
81
-
82
-
83
-
84
-
85
-
86
-
87
-
88
-
89
-
90
-
91
-
92
-
93
-
94
-
95
-
96
-
97
-
98
-
99
-
100
-
101
-
 102
102 -
 103
103 -
 104
104 -
 105
105 -
 106
106 -
 107
107 -
 108
108 -
 109
109 -
 110
110 -
 111
111 -
 112
112 -
 113
113 -
 114
114 -
 115
115 -
 116
116 -
 117
117 -
 118
118 -
 119
119 -
 120
120 -
 121
121 -
 122
122 -
123
-
124
-
125
-
126
-
127
-
128
-
129
-
130
-
131
-
132
-
133
-
134
-
135
-
136
-
137
-
138
-
139
-
140
-
141
-
142
-
143
-
144
-
145
-
146
-
147
-
148
-
149
-
150
-
151
-
152
-
153
-
154
-
155
-
156
-
157
-
158
-
159
-
160
-
161
-
162
-
163
-
164
 |
 |

LEAP WIRELESS INTERNATIONAL, INC.
NOTES TO CONSOLIDATED FINANCIAL STATEMENTS — (Continued)
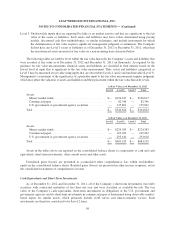
Level 3: Unobservable inputs that are supported by little or no market activity and that are significant to the fair
value of the assets or liabilities. Such assets and liabilities may have values determined using pricing
models, discounted cash flow methodologies, or similar techniques, and include instruments for which
the determination of fair value requires significant management judgment or estimation. The Company
did not have any Level 3 assets or liabilities as of December 31, 2012 or December 31, 2011, other than
the non-financial assets measured at fair value on a non-recurring basis discussed below.
The following tables set forth by level within the fair value hierarchy the Company’s assets and liabilities that
were recorded at fair value as of December 31, 2012 and December 31, 2011 (in thousands). As required by the
guidance for fair value measurements, financial assets and liabilities are classified in their entirety based on the
lowest level of input that is significant to the fair value measurement. Thus, assets and liabilities categorized as
Level 3 may be measured at fair value using inputs that are observable (Levels 1 and 2) and unobservable (Level 3).
Management’s assessment of the significance of a particular input to the fair value measurement requires judgment,
which may affect the valuation of assets and liabilities and their placement within the fair value hierarchy levels.
At Fair Value as of December 31, 2012
Level 1 Level 2 Level 3 Total
Assets:
Money market funds ................................ $— $126,617 $— $126,617
Commercial paper .................................. — 82,346 — 82,346
U.S. government or government agency securities ......... — 135,861 — 135,861
Total .............................................. $— $344,824 $— $344,824
At Fair Value as of December 31, 2011
Level 1 Level 2 Level 3 Total
Assets:
Money market funds ................................ $— $224,383 $— $224,383
Commercial paper .................................. — 165,202 — 165,202
U.S. government or government agency securities ......... — 293,610 — 293,610
Total .............................................. $— $683,195 $— $683,195
Assets in the tables above are reported on the consolidated balance sheets as components of cash and cash
equivalents, short-term investments, other current assets and other assets.
Unrealized gains (losses) are presented in accumulated other comprehensive loss within stockholders’
equity in the consolidated balance sheets. Realized gains (losses) are presented in other income (expense), net in
the consolidated statements of comprehensive income.
Cash Equivalents and Short-Term Investments
As of December 31, 2012 and December 31, 2011, all of the Company’s short-term investments were debt
securities with contractual maturities of less than one year and were classified as available-for-sale. The fair
value of the Company’s cash equivalents, short-term investments in obligations of the U.S. government and
government agencies and its short-term investments in commercial paper is determined using observable market-
based inputs for similar assets, which primarily include yield curves and time-to-maturity factors. Such
investments are therefore considered to be Level 2 items.
98