Cricket Wireless 2012 Annual Report Download - page 80
Download and view the complete annual report
Please find page 80 of the 2012 Cricket Wireless annual report below. You can navigate through the pages in the report by either clicking on the pages listed below, or by using the keyword search tool below to find specific information within the annual report.-
 1
1 -
2
-
3
-
4
-
5
-
6
-
7
-
8
-
9
-
10
-
11
-
12
-
13
-
14
-
15
-
16
-
17
-
18
-
19
-
20
-
21
-
22
-
23
-
24
-
25
-
26
-
27
-
28
-
29
-
30
-
31
-
32
-
33
-
34
-
35
-
36
-
37
-
38
-
39
-
40
-
41
-
42
-
43
-
44
-
45
-
46
-
47
-
48
-
49
-
50
-
51
-
52
-
53
-
54
-
55
-
56
-
57
-
58
-
59
-
60
-
61
-
62
-
63
-
64
-
65
-
66
-
67
-
68
-
69
-
 70
70 -
 71
71 -
 72
72 -
 73
73 -
 74
74 -
 75
75 -
 76
76 -
 77
77 -
 78
78 -
 79
79 -
 80
80 -
 81
81 -
 82
82 -
 83
83 -
 84
84 -
 85
85 -
 86
86 -
 87
87 -
 88
88 -
 89
89 -
 90
90 -
91
-
92
-
93
-
94
-
95
-
96
-
97
-
98
-
99
-
100
-
101
-
102
-
103
-
104
-
105
-
106
-
107
-
108
-
109
-
110
-
111
-
112
-
113
-
114
-
115
-
116
-
117
-
118
-
119
-
120
-
121
-
122
-
123
-
124
-
125
-
126
-
127
-
128
-
129
-
130
-
131
-
132
-
133
-
134
-
135
-
136
-
137
-
138
-
139
-
140
-
141
-
142
-
143
-
144
-
145
-
146
-
147
-
148
-
149
-
150
-
151
-
152
-
153
-
154
-
155
-
156
-
157
-
158
-
159
-
160
-
161
-
162
-
163
-
164
 |
 |

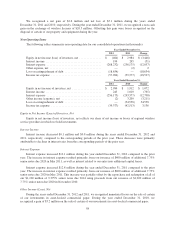
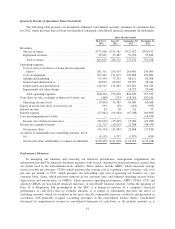
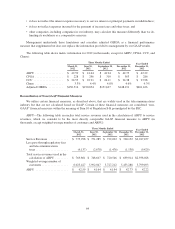
Adjusted OIBDA — The following table reconciles adjusted OIBDA to operating income (loss), which we
consider to be the most directly comparable GAAP financial measure to adjusted OIBDA (in thousands):
Three Months Ended Year Ended
December 31,
2012
March 31,
2012
June 30,
2012
September 30,
2012
December 31,
2012
Operating income (loss) .......... $(15,803) $ 31,589 $ 81,409 $ 60,568 $ 157,763
Plus depreciation and
amortization ............... 146,543 154,483 161,821 162,749 625,596
OIBDA ....................... $130,740 $186,072 $ 243,230 $ 223,317 $ 783,359
Plus (gain) loss on sale, exchange
or disposal of assets, net ...... 468 333 (128,366) (102,149) (229,714)
Plus impairments and other
charges ................... — — 14,753 24,646 39,399
Plus share-based compensation
expense (benefit) ........... (694) 4,429 2,010 2,377 8,122
Adjusted OIBDA ............... $130,514 $190,834 $ 131,627 $ 148,191 $ 601,166
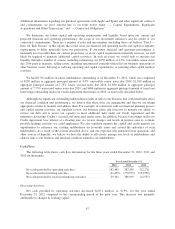
Liquidity and Capital Resources
Overview
Our principal sources of liquidity are our existing unrestricted cash, cash equivalents and short-term
investments and cash generated from operations. We had a total of $675.0 million in unrestricted cash, cash
equivalents and short-term investments as of December 31, 2012. We generated $182.4 million of net cash from
operating activities during the year ended December 31, 2012, compared to $387.5 million during the year ended
December 31, 2011. The decrease in net cash from operating activities was primarily attributable to changes in
working capital. We expect cash generated from operations to continue to be a significant source of liquidity. We
believe that our existing unrestricted cash, cash equivalents and short term investments, together with cash
generated from operations, provide us with sufficient liquidity to meet the operating and capital requirements for
our current business operations and current investment initiatives until our senior secured notes mature in 2016.
We expect that we will need to refinance all or substantially all of our $1.1 billion of senior secured notes due
2016 before they mature.
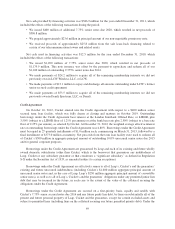
We intend in the near term to refinance and extend the maturities of all or substantially all of our senior
indebtedness due between 2014 and 2016 if we are able to do so on favorable terms. There can be no assurance,
however, that we will be able to refinance any of our indebtedness on favorable terms or at all.
Our current investment initiatives include the ongoing maintenance and development of our network and
other business assets to allow us to continue to provide customers with high-quality service. In addition, we are
exploring cost-effective ways to deliver LTE services to customers in our network footprint. We have deployed
LTE across approximately 21 million POPs in our network footprint and may launch the service to up to an
additional approximately 10 million POPs in 2013. In addition, we may enter into partnerships or joint ventures
with others to supplement our facilities-based LTE network coverage. We intend to be disciplined as we consider
investment initiatives and to remain focused on our position as a low-cost provider of wireless
telecommunications services. Total capital expenditures for 2013 are expected to be between $275 million and
$325 million. For additional information regarding our projected capital expenditures for the next several years,
see the discussion below under “-Capital Expenditures, Significant Acquisitions and Other Transactions”.
In recent years, we have entered into agreements with significant purchase commitments, including an
agreement with Apple to purchase an estimated $800 million of iPhone devices between June 2012 and June
2015 and an agreement with Sprint to purchase a minimum of $205 million of services between 2013 and 2015.
66