Cricket Wireless 2012 Annual Report Download - page 74
Download and view the complete annual report
Please find page 74 of the 2012 Cricket Wireless annual report below. You can navigate through the pages in the report by either clicking on the pages listed below, or by using the keyword search tool below to find specific information within the annual report.-
 1
1 -
2
-
3
-
4
-
5
-
6
-
7
-
8
-
9
-
10
-
11
-
12
-
13
-
14
-
15
-
16
-
17
-
18
-
19
-
20
-
21
-
22
-
23
-
24
-
25
-
26
-
27
-
28
-
29
-
30
-
31
-
32
-
33
-
34
-
35
-
36
-
37
-
38
-
39
-
40
-
41
-
42
-
43
-
44
-
45
-
46
-
47
-
48
-
49
-
50
-
51
-
52
-
53
-
54
-
55
-
56
-
57
-
58
-
59
-
60
-
61
-
62
-
63
-
 64
64 -
 65
65 -
 66
66 -
 67
67 -
 68
68 -
 69
69 -
 70
70 -
 71
71 -
 72
72 -
 73
73 -
 74
74 -
 75
75 -
 76
76 -
 77
77 -
 78
78 -
 79
79 -
 80
80 -
 81
81 -
 82
82 -
 83
83 -
 84
84 -
85
-
86
-
87
-
88
-
89
-
90
-
91
-
92
-
93
-
94
-
95
-
96
-
97
-
98
-
99
-
100
-
101
-
102
-
103
-
104
-
105
-
106
-
107
-
108
-
109
-
110
-
111
-
112
-
113
-
114
-
115
-
116
-
117
-
118
-
119
-
120
-
121
-
122
-
123
-
124
-
125
-
126
-
127
-
128
-
129
-
130
-
131
-
132
-
133
-
134
-
135
-
136
-
137
-
138
-
139
-
140
-
141
-
142
-
143
-
144
-
145
-
146
-
147
-
148
-
149
-
150
-
151
-
152
-
153
-
154
-
155
-
156
-
157
-
158
-
159
-
160
-
161
-
162
-
163
-
164
 |
 |

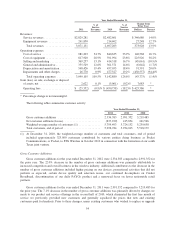
respectively. For the years ended December 31, 2012 and 2011, depreciation expense of our unrestricted
subsidiaries was approximately $4.5 million and $2.2 million, respectively, resulting in a net loss of
approximately $4.5 million and $2.2 million, respectively.
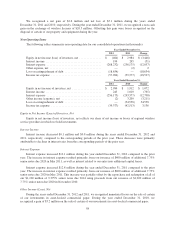
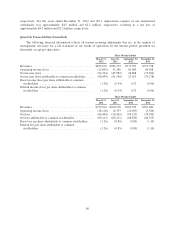
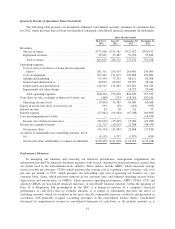
Quarterly Financial Data (Unaudited)
The following financial information reflects all normal recurring adjustments that are, in the opinion of
management, necessary for a fair statement of our results of operations for the interim periods presented (in
thousands, except per share data):
Three Months Ended
March 31,
2012
June 30,
2012
September 30,
2012
December 31,
2012
Revenues ......................................... $825,619 $786,772 $773,972 $755,978
Operating income (loss) ............................. (15,803) 31,589 81,409 60,568
Net income (loss) .................................. (94,334) (45,987) 26,868 (73,824)
Net income (loss) attributable to common stockholders ..... (98,439) (41,590) 25,015 (74,278)
Basic income (loss) per share attributable to common
stockholders .................................... (1.28) (0.54) 0.32 (0.96)
Diluted income (loss) per share attributable to common
stockholders .................................... (1.28) (0.54) 0.32 (0.96)
Three Months Ended
March 31,
2011
June 30,
2011
September 30,
2011
December 31,
2011
Revenues ......................................... $779,914 $760,538 $763,279 $767,400
Operating income (loss) ............................. (18,110) 12,337 (16,053) (3,526)
Net loss .......................................... (86,440) (58,442) (94,125) (78,670)
Net loss attributable to common stockholders ............ (96,211) (65,211) (68,830) (84,375)
Basic loss per share attributable to common stockholders . . . (1.26) (0.85) (0.90) (1.10)
Diluted loss per share attributable to common
stockholders .................................... (1.26) (0.85) (0.90) (1.10)
60