Cricket Wireless 2012 Annual Report Download - page 78
Download and view the complete annual report
Please find page 78 of the 2012 Cricket Wireless annual report below. You can navigate through the pages in the report by either clicking on the pages listed below, or by using the keyword search tool below to find specific information within the annual report.-
 1
1 -
2
-
3
-
4
-
5
-
6
-
7
-
8
-
9
-
10
-
11
-
12
-
13
-
14
-
15
-
16
-
17
-
18
-
19
-
20
-
21
-
22
-
23
-
24
-
25
-
26
-
27
-
28
-
29
-
30
-
31
-
32
-
33
-
34
-
35
-
36
-
37
-
38
-
39
-
40
-
41
-
42
-
43
-
44
-
45
-
46
-
47
-
48
-
49
-
50
-
51
-
52
-
53
-
54
-
55
-
56
-
57
-
58
-
59
-
60
-
61
-
62
-
63
-
64
-
65
-
66
-
67
-
 68
68 -
 69
69 -
 70
70 -
 71
71 -
 72
72 -
 73
73 -
 74
74 -
 75
75 -
 76
76 -
 77
77 -
 78
78 -
 79
79 -
 80
80 -
 81
81 -
 82
82 -
 83
83 -
 84
84 -
 85
85 -
 86
86 -
 87
87 -
 88
88 -
89
-
90
-
91
-
92
-
93
-
94
-
95
-
96
-
97
-
98
-
99
-
100
-
101
-
102
-
103
-
104
-
105
-
106
-
107
-
108
-
109
-
110
-
111
-
112
-
113
-
114
-
115
-
116
-
117
-
118
-
119
-
120
-
121
-
122
-
123
-
124
-
125
-
126
-
127
-
128
-
129
-
130
-
131
-
132
-
133
-
134
-
135
-
136
-
137
-
138
-
139
-
140
-
141
-
142
-
143
-
144
-
145
-
146
-
147
-
148
-
149
-
150
-
151
-
152
-
153
-
154
-
155
-
156
-
157
-
158
-
159
-
160
-
161
-
162
-
163
-
164
 |
 |

• it does not reflect the interest expense necessary to service interest or principal payments on indebtedness;
• it does not reflect expenses incurred for the payment of income taxes and other taxes; and
• other companies, including companies in our industry, may calculate this measure differently than we do,
limiting its usefulness as a comparative measure.
Management understands these limitations and considers adjusted OIBDA as a financial performance
measure that supplements but does not replace the information provided to management by our GAAP results.
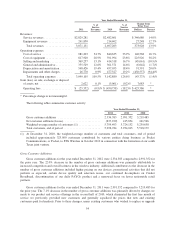
The following table shows metric information for 2012 (in thousands, except for ARPU, CPGA, CCU, and
Churn):
Three Months Ended Year Ended
December 31,
2012
March 31,
2012
June 30,
2012
September 30,
2012
December 31,
2012
ARPU ................... $ 42.59 $ 41.64 $ 41.94 $ 42.73 $ 42.22
CPGA ................... $ 228 $ 296 $ 310 $ 363 $ 286
CCU .................... $ 24.55 $ 22.91 $ 24.11 $ 24.38 $ 23.98
Churn ................... 3.3% 4.4% 4.8% 4.6% 4.3%
Adjusted OIBDA .......... $130,514 $190,834 $131,627 $148,191 $601,166
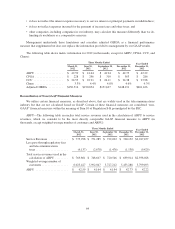
Reconciliation of Non-GAAP Financial Measures
We utilize certain financial measures, as described above, that are widely used in the telecommunications
industry but that are not calculated based on GAAP. Certain of these financial measures are considered “non-
GAAP” financial measures within the meaning of Item 10 of Regulation S-K promulgated by the SEC.
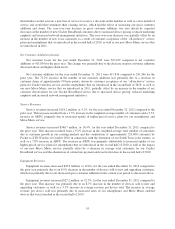
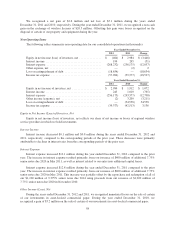
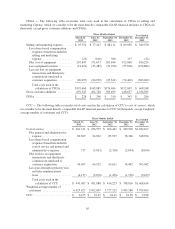
ARPU—The following table reconciles total service revenues used in the calculation of ARPU to service
revenues, which we consider to be the most directly comparable GAAP financial measure to ARPU (in
thousands, except weighted-average number of customers and ARPU):
Three Months Ended Year Ended
December 31,
2012
March 31,
2012
June 30,
2012
September 30,
2012
December 31,
2012
Service Revenues ............. $ 773,998 $ 751,285 $ 722,022 $ 700,152 $2,947,457
Less pass-through regulatory fees
and telecommunications
taxes ...................... (4,137) (2,678) (1,476) (1,138) (9,429)
Total service revenues used in the
calculation of ARPU ......... $ 769,861 $ 748,607 $ 720,546 $ 699,014 $2,938,028
Weighted-average number of
customers .................. 6,025,427 5,992,047 5,727,212 5,453,288 5,799,493
ARPU ...................... $ 42.59 $ 41.64 $ 41.94 $ 42.73 $ 42.22
64