Cricket Wireless 2012 Annual Report Download - page 72
Download and view the complete annual report
Please find page 72 of the 2012 Cricket Wireless annual report below. You can navigate through the pages in the report by either clicking on the pages listed below, or by using the keyword search tool below to find specific information within the annual report.-
 1
1 -
2
-
3
-
4
-
5
-
6
-
7
-
8
-
9
-
10
-
11
-
12
-
13
-
14
-
15
-
16
-
17
-
18
-
19
-
20
-
21
-
22
-
23
-
24
-
25
-
26
-
27
-
28
-
29
-
30
-
31
-
32
-
33
-
34
-
35
-
36
-
37
-
38
-
39
-
40
-
41
-
42
-
43
-
44
-
45
-
46
-
47
-
48
-
49
-
50
-
51
-
52
-
53
-
54
-
55
-
56
-
57
-
58
-
59
-
60
-
61
-
 62
62 -
 63
63 -
 64
64 -
 65
65 -
 66
66 -
 67
67 -
 68
68 -
 69
69 -
 70
70 -
 71
71 -
 72
72 -
 73
73 -
 74
74 -
 75
75 -
 76
76 -
 77
77 -
 78
78 -
 79
79 -
 80
80 -
 81
81 -
 82
82 -
83
-
84
-
85
-
86
-
87
-
88
-
89
-
90
-
91
-
92
-
93
-
94
-
95
-
96
-
97
-
98
-
99
-
100
-
101
-
102
-
103
-
104
-
105
-
106
-
107
-
108
-
109
-
110
-
111
-
112
-
113
-
114
-
115
-
116
-
117
-
118
-
119
-
120
-
121
-
122
-
123
-
124
-
125
-
126
-
127
-
128
-
129
-
130
-
131
-
132
-
133
-
134
-
135
-
136
-
137
-
138
-
139
-
140
-
141
-
142
-
143
-
144
-
145
-
146
-
147
-
148
-
149
-
150
-
151
-
152
-
153
-
154
-
155
-
156
-
157
-
158
-
159
-
160
-
161
-
162
-
163
-
164
 |
 |

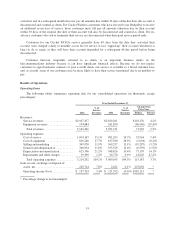
We recognized a net gain of $2.6 million and net loss of $5.1 million during the years ended
December 31, 2011 and 2010, respectively. During the year ended December 31, 2011, we recognized a non-cash
gain on the exchange of wireless licenses of $20.5 million. Offsetting this gain were losses recognized on the
disposal of certain of our property and equipment during the year.
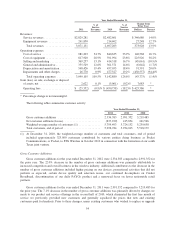
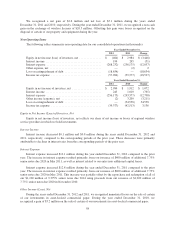
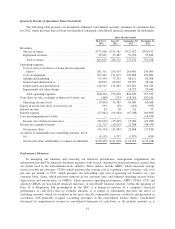
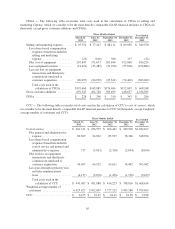
Non-Operating Items
The following tables summarize non-operating data for our consolidated operations (in thousands):
Year Ended December 31,
2012 2011 Change
Equity in net income (loss) of investees, net ............... $ (464) $ 2,984 $ (3,448)
Interest income ...................................... 194 245 (51)
Interest expense ..................................... (268,232) (256,175) (12,057)
Other expense, net ................................... — (2) 2
Loss on extinguishment of debt ......................... (18,634) — (18,634)
Income tax expense .................................. (57,904) (39,377) (18,527)
Year Ended December 31,
2011 2010 Change
Equity in net income of investees, net .................... $ 2,984 $ 1,912 $ 1,072
Interest income ...................................... 245 1,010 (765)
Interest expense ..................................... (256,175) (243,377) (12,798)
Other income (expense), net ........................... (2) 3,209 (3,211)
Loss on extinguishment of debt ......................... — (54,558) 54,558
Income tax expense .................................. (39,377) (42,513) 3,136
Equity in Net Income (Loss) of Investees, Net
Equity in net income (loss) of investees, net reflects our share of net income or losses of regional wireless
service providers in which we hold investments.
Interest Income
Interest income decreased $0.1 million and $0.8 million during the years ended December 31, 2012 and
2011, respectively, compared to the corresponding periods of the prior year. These decreases were primarily
attributable to declines in interest rates from the corresponding periods of the prior year.
Interest Expense
Interest expense increased $12.1 million during the year ended December 31, 2012 compared to the prior
year. The increase in interest expense resulted primarily from our issuance of $400 million of additional 7.75%
senior notes due 2020 in May 2011, as well as interest related to our entry into additional capital leases.
Interest expense increased $12.8 million during the year ended December 31, 2011 compared to the prior
year. The increase in interest expense resulted primarily from our issuance of $400 million of additional 7.75%
senior notes due 2020 in May 2011. This increase was partially offset by the repurchase and redemption of all of
our $1,100 million of 9.375% senior notes due 2014 using proceeds from our issuance of $1,200 million of
7.75% senior notes due 2020 in November 2010.
Other Income (Loss), Net
During the years ended December 31, 2012 and 2011, we recognized immaterial losses on the sale of certain
of our investments in asset-backed commercial paper. During the year ended December 31, 2010, we
recognized a gain of $3.2 million on the sale of certain of our investments in asset-backed commercial paper.
58